Software & tools
Lamp
Lamp (large array manipulation programme) allows you to visualise ILL data files as well as other types, like for example inx files. It is based on the idl package (interactive data language). Lamp is a multi-purpose program and can be used for data treatment by using macros written in idl, Fortran or C. See the LAMP BOOK.
Nplot/Plotmultiple (Matlab)
Matlab routines for treatment of Data from triple axis spectrometers (single detector and Flatcone).
(nplot, plotmultiple, etc.)
Instructions: download and copy in a directory of your choice. Then make sure that this directory is included in your Matlab PATH settings.
Author: Paul Steffens
Your questions and suggestions are welcome to steffens(at)ill.fr
PkFit, Filing
PkFit - a user friendly software for MacOS, OpenVMS and UNIX computers - is intended for the data processing of neutron Three-Axis Spectrometers (TAS). Inelastic, quasi-elastic or elastic spectra are fitted by a linear background plus a series of peak functions. The program offers several build-in peak functions but the user may add its own peak shapes through plug-in routines. The model can include the Bose factor, the kf or ki correction, the neutron absorption and the convolution of the signal with a one-dimensional or a four-dimensional resolution function. The later is calculated from the configuration parameters of the spectrometer through the help of the Cooper-Nathans method [3] or the Popovici method [4]. Fast 4D integration is performed by means of new methods, one based on a Monte-Carlo integration technique and the other based on a Gaussian approximation.
Filing - a user friendly software for MacOS, OpenVMS and UNIX computers - is intended for the data file handling of neutron Three-Axis Spectrometers (TAS).
Restrax
Restrax is a tool for simulating the neutron optics of three-axis spectrometers (TAS) to optimise their resolution and luminosity and to interpret experimental data collected with them. The program code includes both a high-speed analytical (Gaussian) convolution algorithm and a Monte Carlo ray-tracing method providing enhanced accuracy in description of most of the spectrometer components.
Simres
Simres provides instrument scientists with more flexible (and more realistic) ray-tracing code useful for simulation of newly designed or upgraded instruments and optimisation of their configuration. This version permits to simulate intensity and distribution of neutron beam in both real and momentum subspaces at different positions along the TAS beamline.
vTAS
A Virtual Three Axis Spectrometer - Using a Three Axis Spectrometer (TAS) is not easy since one has constantly translate parameters from real space to reciprocal space and vice versa
The goal of vTAS is to provide an interactive and graphical display of both the instrument configuration and the corresponding measured space thus making easier the understanding of the behavior of the instrument and its limits.
Simulation mode: vTAS allows experimentation with sample parameters, for example the Miller indices of the unit cell, whilst maintaining a representation of the instruments physical state, for example the location of the walls around the instrument, and its angular limits.
Data viewer mode: vTAS is capable of reading ILL TAS data files. It displays both the data and the corresponding instrument configuration.
vTAS also supports the multiplexed geometry FLATCONE both in the simulation mode and data viewer mode. A version with support for IMPS is now being prepared and a version with support of UFO is anticipated.
The first version of vTAS was developped by Alain Bouvet in 1998.
The new vTAS project was funded by the ILL and NMI3.
Others
If anybody want to share his knowledge in ToF/HR data treatment, he is kindly invited to send his bug-free well documented code to J. Ollivier. The code will be added to the list after checking. Any programming language is accepted.
Spurions is a commonly used expression for parasitic signals, which can be easily mistaken as real signals from the studied sample. There are different origins of spurions. Most of them are linked to a specific instrumental set-up or the chosen sample environment. In the following we give a list of the most common spurions run across in classical TAS experiments:
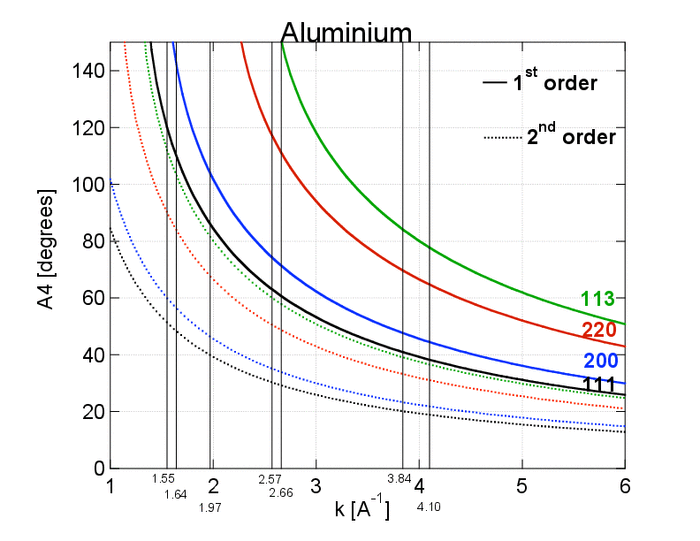
Bragg peaks from Aluminium or Copper in the beam.
Harmonic wavelengths in ki and kf
Bragg/phonon contamination
Incoherent scattering of monochromator/analyzer:
A small part (10-5) of the incoming beam is always scattered incoherently by the monochromator or the analyzer. It is then possible to get a Bragg reflection from the sample or the sample container for this ki or kf
Remedies/tests:
A scanning on A3 sample rotation will have the width of a Bragg peak; -) Moving the monochromator or analyzer will make the 'good' signal to disappear, but the incoherent contamonation will remain; -) Changing ki or kf will make that peak move.
Protection leaks:
For some spectrometer configurations, the detector can be in the axis of the incoming beam. Fast neutrons that may pass the protections will give an additional peak. Also, for small A4 angles, one can have an additional scattering from tubes lying in the incoming beam, that would 'deviate' the beam toward the analyzer and detector.
Phonon on monochromator or analyzer:
These phonons will not depend on temperature or A3!