More
Examples
Capability map - examples of measurement & counting times on FIGARO
Measurement of the surface excess (single deuterated component) or a contribution to the surface composition (selected deuterated component in a multi-component system) can be measured at low Q in air contrast matched water with an uncertainty of 2% in as little as 1 min, and useable kinetic measurements in user experiments have been carried out in as little as 1 sec.
Structural measurements over the whole Q-range (0.005-0.4 A-1) in a D2O subphase can be measured in as little as 2 min. These counting times apply to free liquid surfaces with a surface area of at least 60x40 mm, and they compare favourably with those on the previous generation of neutron reflectometers. Examples of data of each type of measurement can be found in FIGARO's technical paper (see Publication section). In practice, however, it must be stated that the counting time depends on the scattering contrast in the surface layer, the sample environment and the instrument settings used, and typical run times are on the order of 30-60 minutes per sample.
Specular reflectivity measurements over the whole Q-range (0.005-0.4 A-1) depend on the scattering contrast of the surface layer, the size of the solid crystal and the instrument settings used. For typical sample cells and instrument configurations, a minimum reflected signal of 5 x 10⁻⁷ or 1 x 10⁻⁶ after background subtraction can be obtained for D2O or H2O, respectively. Without taking further measures to reduce background scattering, this limits the maximum measurable Qz to approximately 0.20 to 0.25 A-1 for samples with 5-A rms roughness. Typical counting times using 80x50 mm crystals, 7% wavelength resolution and a 20-A frame overlap mirror are 45 min in D2O, 60 min in H2O and 90 min in a contrast matched subphase.
GISANS/NSSANS
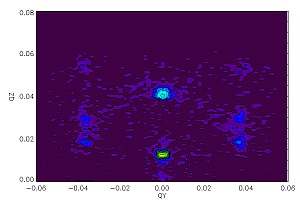
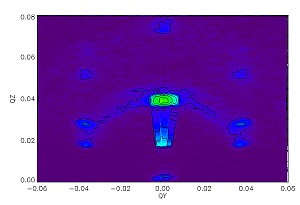
Grazing incidence small angle scattering (GISANS) and near surface small angle scattering (NSSANS) can be used to obtain in-plane correlations and structural information within thin films. For GISANS, incident neutrons strike the sample below the critical angle for reflection and generate an evanescent wave with a penetration depth of ~100 Å. In this case, scattering from the sample is restricted to the interface. For NSSANS, neutrons impinging above the critical angle penetrate deeper into the sample (10-100 µm) and scatter from the bulk material.
As a time-of-flight instrument, FIGARO records the scattering pattern as a function of lambda (resulting in different critical angles for reflection) and can simultaneously acquire GISANS and NSSANS data. For the standard sample to detector separation, the detector receives an angular acceptance of ± 5° parallel to the sample plane and +5° perpendicular to the sample plane. This yields a maximum QY = ± 0.1 Å-1 and QZ = 0.1 Å-1 for 5 Å and a maximum QY = ± 0.035 Å-1 and QZ = 0.035 Å-1 for 15 Å neutrons.
An estimate of the range of lengthscales of lateral correlations that can be probed on FIGARO is 8-200 nm. In special cases, the detector can be moved closer to the detector to increase the angular acceptance to ± 25° parallel to the sample plane and 25° perpendicular to the sample plane. GISANS (left) and NSSANS (right) images of pluronic polymer micelles at the solid/liquid interface are shown below.
For Users
Remote instrument access (VISA) Experimental logs Remote data access D17 status on Nomad ILL User Club
Risk Assessment
The DSI, ASI and other security documents of FIGARO can be found here (intranet only).
FIGARO Manual V20 (september 2019)
In the following link you can find the latest copy of the FIGARO manual for users and local contacts. It contains information about how to use the instrument, how to set up an experiment including a solid/liquid interface experiment involving a horizontal sample offset, instructions for setting up adsorption troughs or Langmuir trough experiments, how to reduce and transfer your data, and what to do in case of instrument problems. Please send any suggestions for additional information to the instrument responsibles.
The calibration parameters can be found here.
FIGARO/D17 Data Reduction Software
A new version of Cosmos (v3.0) with an enhanced graphical interface was launched at the start of the June 2012 cycle. The functionality is much improved with the display now tabbed rather than having lots of separate windows, copy/paste in the data table, seemless interchange from 2 to 3 angles, an automatic normalization feature, an option to select only the data output formats you want, and an interactive plot feature with animation. This development was possible due to the great work of Eric Pellegrini and Miguel Gonzales both of whom we thank warmly.
To run the new Cosmos please do a 'live update' of your current version of Lamp. Then re-start the software and launch Cosmos. If you have a very old version of Lamp, however, you may get v2.39 along with a message to re-install Lamp. This is because the new Cosmos runs on the programming code IDL8. In this case you do not need to uninstall your old version of Lamp, but you do need to install the new version, which can be downloaded here.
Note that the new Cosmos must be used for all FIGARO data recorded from June 2012 onwards due to an update of the sample-to-detector distance calculations and the chopper parameters in the data files which affects Q. Further changes can be found in the 'news' section of the new Cosmos. If you encounter any problems or if you have suggestions for future improvements the instrument running team would be very grateful for your feedback.
Reduced Data Formats
Fourth and fifth data output formats have been launched over the last few years.
One is called .mft and has normalized, binned data with a fourth column for the Q resolution. In addition there is some useful information in the header about the experiment, the settings and the files used to reduce the data. A feature of the .mft format is the possibility to have up to nine configurable parameters listed in the header from the raw data files or calculation options. This allows the header of the reduced data from a given experiment to include tailored information from the experiment itself (e.g. a lipid monolayer experiment on a Langmuir trough experiment could have 'Langmuir area' whereas a solid/liquid bilayer phase transition experiment may prefer 'sample temperature'). Input into this concept from Ángel Piñeiro and Adrian Rennie is gratefully acknowledged.
The other new format is called .lam which is equivalent to .mft but has a fifth column as lambda and skips the optional extra header information. This file is used for the application of wavelength-dependent transmission corrections to the reflectivity while retaining all the other information. An example of these experiment is liquid/liquid interface measurements. Transmission corrections should be carried out by the user and then the file may need to be converted back to four columns (i.e. deletion of the lambda column) depending on the analysis software used. Input into this concept from Ali Zarbakhsh is gratefully acknowledged.
Here is a short summary of the five formats available. AFT = binned, normalised data in three columns (Q, R, dR); 4 lines of header; all points included over the q-ranges selected.
DAT = binned, normalised data in three columns (Q, R, dR); 0 lines of header; negative points removed. MFT = binned, normalised data in four columns (Q, R, dR, dQ); 23 lines of header; all points included over the q-ranges selected. OUT = unbinned, unnormalised data in four columns (Q, R, dR, dQ); 42 lines of header; all points included over the q-ranges selected. LAM = binned, normalised data in five columns (Q, R, dR, dQ, lambda); 13 lines of header; all points included over the q-ranges selected.
Cosmos Updates
The updates to Cosmos from 2009 until 2011 can be found in the following file. Subsequent updates, implemented in the new Cosmos from June 2012 onwards, are listed in the software itself in the 'news' section. Such updates will not be duplicated in the following file, so this file is now fixed and will not be updated again.
A manual for COSMOS can be found here.
Normalization of 2d detector images
A siimple list of LAMP commands can be used to reduce 2D detector images into normalized wavelength vs. scattering angle space:
;Instrument parameters (You can find them when loading the raw measurement into LAMP and clicking on the "Data Params" buton):
x40 = 358.32 ;Poff (degrees)
x41 = 1418. ;Chop Actual Speed (rpm)
x42 = -123.76 ;(Trailing) Chop Actual Phase (deg) (relative to leading chopper)
x44 = 169.28 ;Open Offset (deg)
x45 = 40 ;TOF Channel Width (microsec)
x46 = 20000 ;TOF E-delay (microsec)
x47 = 5497. ;(Mid-) Chopper-Sample Distance (mm) (D1)
x48 = 2829. ;Sample-Detector Distance (mm)
y57 = 128.219 ;xcenter of reflected beam
y56 = 2.726 ;Wanted Theta (deg)
y58 = -1. ;-1 for reflection down, +1 for reflection up
;load OSS pattern into w2
x56=1800.0*5 ;OSS counting time (sec)
e2=sqrt(w2)
;load direct beam into w1
x55=1800./9. ;DB counting time (sec)/Attenuation
;DB integration
w3=total(w1,2)
e3=sqrt(w3)
x3=((x3+0.5)*x45+x46-(x40-x42+45.-x44)/(0.000012*x41))/((x47+x48)*0.2528)
;rotate image to make it look like D17
w4=transpose(w2)
;convert y-axis to wavelength:
y4=((y4+0.5)*x45+x46-(x40-x42+45.-x44)/(0.000012*x41))/((x47+x48)*0.2528)
;2d_norm You can choose the wavelength range you want according to the FO used
w5=d17_2dnorm(w4,w3,lrange=[2.0,16])*x55/x56
e5=e5*x55/x56
;convert x-axis to 2theta
x5=2*y56+y58*atan((x4-y57)*1.2/x48)*180/!PI
;restrict to the useful pixel range of the detector
w6=w5[25:171,*]
This list of commands can be found in an .xbu file as well. Note that this procedure does not include a gravity correction, which becomes significant for neutron wavelengths longer than 2 nm.
To further transform into q-space and load the maps into common programs please go here and follow the instructions in the D17 LAMP Book.
FIGARO Data Format List
Here are all the versions of the FIGARO data format. Subsequent numbered versions will be uploaded here. A document containing a brief list of changes to each version is then listed. Also, a document explaining the changes to the data block format in v12 is listed. The old versions of the data format are retained. Examples of the raw data file from the old and new data block formats are then given. Note that in the document stating the changes, the definition of the parameter blocks is that the first entry starts at 0 (not 1). If you require any explanations of the parameter labels then please get in touch with the instrument responsibles.
150605-figaro-data-format-v12.pdf
FIGARO Data Format Version 12 (05/06/15 to present).
150605-figaro-data-format-list-changes.pdf
List of changes to the data format (last on 05/06/15).
130405-figaro-data-format-v11.pdf
FIGARO Data Format Version 11 (05/04/13 to 05/06/15).
130219-figaro-data-block-format.pdf
FIGARO Data Block Format (19/02/13 to present).
130219-figaro-data-format-v10.pdf
FIGARO Data Format Version 10 (19/02/13 to 05/04/13).
120419-figaro-data-format-v9.pdf
FIGARO Data Format Version 9 (19/04/12 to 19/02/13).
101129-figaro-data-format-v8.pdf
FIGARO Data Format Version 8 (29/11/10 to 19/04/12).
101028-figaro-data-format-v7.pdf
FIGARO Data Format Version 7 (28/10/10 to 29/11/10).
100623-figaro-data-format-v6.pdf
FIGARO Data Format Version 6 (23/06/10 to 28/10/10).
090819-figaro-data-format-v5.pdf
FIGARO Data Format Version 5 (19/08/09 to 23/06/10).
090625-figaro-data-format-v4.pdf
FIGARO Data Format Version 4 (25/06/09 to 19/08/09).
090617-figaro-data-format-v3.pdf
FIGARO Data Format Version 3 (17/06/09 to 25/06/09).
090603-figaro-data-format-v2-changes.pdf
FIGARO Data Format Version 2 (03/06/09 to 17/06/09).
090415-figaro-data-format-v1.pdf
FIGARO Data Format Version 1 (15/04/09 to 03/06/09).
fileadmin/users_files/media/instruments/FIGARO/doc/356092 356092
Example of a tof raw data file with the old data block format: #356092.
fileadmin/users_files/media/instruments/FIGARO/doc/365860 365860
Example of a tof raw data file with the new data block format: #365860.
FIGARO Horizontal Geometry
The document below gives a description of the horizontal geometry of components of the FIGARO instrument. The only change from v1 to v2 is a refinement by a couple of centimetres of the sample-to-detector distance.