
Page 99 - ILL Annual Report 2019
P. 99
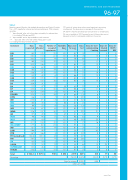
  ‘days allocated’ refers only to those days reviewed by the subcommittees (i.e. excluding CRG days and DDT)
‘days available’ are the days available on each instrument
**
***
(i.e. including CRG days for CRGs and DDT)
‘days used’ refers to the total number of days given to users
EXPERIMENTAL AND USER PROGRAMME
96-97
 Table 2
Beamtime request/allocation (via standard subcommittees and Director Discretion Time —DDT—together) by instrument and instrument performance. CRG instruments are in blue.
*
PF2 consists of various set-ups where several experiments are running simultaneously. The values given are averages for these positions.
D4 and IN1 share the same beam port and cannot be run simultaneously.
D3 was not available in 2019 because the new H4 beam tube was not delivered on time for its anticipated installation in the summer.
    Instrument Days Days Number of Available requested allocated accepted days * experiments **
Days used for users ***
97 80
78
75
85
87
86
73
86
80
83
40
86
95
69
74
Days lost
3 3
8
3
3
4
5
5
2
2
3
2
2
3
13
22
Days for test/ Days for commissioning internal /training research
Days for EASY/ DDT
0 6 0 3 3 6 3 1 0 9 2
     2
     2
     0
     6
     0
     7
     1
     0
     1
     0
     2
     0
     0
     1
     0
     0
     0
     0
     0
     0
     0
     0
     1
     2
58
1.7 %
  D10 164
D11 220
D16 200
D17 189
D19 202 D1B 156 D20 183
D22 226
D23 152
D2B 168 D33 249
D3 209
D4 110
D7 253 D9 207 FIGARO 203 FIPPS 156
135 110
100
104
106
62
102
97
42
105
105
20 101 61 101
19 101
32 101
15 101
29 101
49 101
53 101
8 101
51 101
36 101
    1
   12
    4
   17
   10
    3
    5
   19
   10
    5
   13
    9
   11
    3
    6
    4
    1
    5
   12
   10
   21
    7
    9
   23
   16
    1
   17
   45
    8
    1
    5
    2
   13
    9
    4
341
10.0 %
84%
0
0 11 3 0 1 2 3 3 5 0
   0
   0
   0
   3
   1
   4
   7
   0
   2
   1
   2
   0
   0
   0
   0
   0
   0
   0
14 0 0 23 0 6
91
2.7 %
                                                                                  31 5
       47
101
109
118
110
12 53
20 101
13 101
39 97
7 101
                                          IN11 233 91
IN12 189 35
IN13 89 55
IN15 208 87
IN16B 276 107
IN1 137 40
IN20 98 90
IN22 142 43
IN5 311 104
IN6-SHARP 177 65
13 101   37   52
7 82   67   2
8 101   76   13
18 101   83   5
30 101   57   22
13 47   31   5
15 101   86   6
7 101   48   30
32 101   77   7
22 101   95   5
19 101   81   3
11 101   54   2
9 101   69   24
                                                                      IN8 161 LADI 286 PF1B 367
97
98
166
133.5
127
18
54
46
117
3 157.5
                       PF2 normalised PN1
S18
SALSA SUPERADAM THALES
Total
Percentage
160.6 265 135 125 100 256
6 962.6
18 101
59
27
       14
2
19
10
22
758
101   68   28
101   94   5
101   59   6
101   89   2
101   87   2
                              3 410
2 591
76.0 %
329
9.6 %
2740
             Days for science
   2591+91+58
  www.ill.eu
