
Page 41 - ILL Annual Report 2019
P. 41
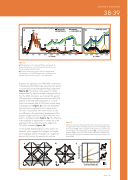
 Figure 2
a)
(A)
(B)
(C2) (P)
INS S(Q,ћ ) AIMD S(Q,ћ )
(β2) (E2)
IR BIO92
IR 501nBZO (★)
(G)
b)
SCIENTIFIC HIGHLIGHTS
38-39
AIMD G(ћ ) H(2) (F)
(β2) (E2)
(C1)
a) INS (black line and circles) and IR (blue line) spectra of Ba2In2O5(H2O)0.92, and calculated scattering function of the fully hydrated model (red line).
b) Close-up of the energy region of the (E) and (β) bands. The IR spectrum of 50In/BZO (green line), reproduced and adapted with permission from [4], is also represented.
IR spectra are signatures, not of δ(O-H(2)) overtones but of fundamental n(O-H(2)) modes associated with protons in a particularly strong hydrogen-bonding configuration (figure 2b). This feature is also present in related In-doped BaZrO3 materials at high In-doping levels [4]. From the AIMD simulations, we correlated this specific H(2) population to configurations where the O(3)–O(3) distance of the O(3)–H(2)---O(3) pattern is < 2.6 Å, close to the transient state of H(2) proton transfer along its hydrogen bond (figure 3c). We also established that two local environments for H(1) coexist on the
H(1) site, in accordance with recent studies [3], due
to a difference in the amplitude of displacement of the acceptor oxygen atom [O(1), O(3)] to which the H(1) proton is hydrogen-bonded (figure 3a). The difference in the amplitude of displacement is notably due to the alignment of the covalent bond on the edge of the O(1)4O(2)2 octahedra (figure 3b).
For the partially hydrated phases, similar spectra are obtained, which suggests that hydrogen and oxygen atoms segregate and form hydrogen-rich, oxygen-rich domains that maintain the pseudo-cubic structure.
Figure 3
a)
c
a
strong pull b) 0.4–0.7 Å O(1)
O(2)
c)
H(1) weak pull O(3)
alignment O(2)-H(1)-O(1)
2.2 1.8 1.4 1.0
(4h) normal
(2c) transient O(3)
H(2)
(D)
(β1) (E1)
(F)
(β1) (E1)
50 100 150 200 250 300 350 400 450
220 260 300 340 380
ћ (meV)
0.1–0.3 Å b
2.4
2.6 2.8
3.0 3.2
ћ (meV)
H(2) bond lengths [Å]
Intensity (a.u.)
a
O(3)–O(3) distance [Å]
Schematic drawing of the pseudo-cubic phase showing the amplitude of displacement of O(1) and O(3) under the pull of the hydrogen bonds of H(1) protons (a), and the alignment of the O(2)–H(1) covalent bond with the edges of the O(1)4O(2)2 octahedra (b). Correlation between the bond lengths of the O(3)–H(2) covalent bond (below dashed line), the H(2)---O(3) hydrogen bond (above dashed line) and the O(3)–O(3) distance (c).
www.ill.eu
