
Page 97 - ILLS Annual Report 2018
P. 97
EXPERIMENTAL AND USER PROGRAMME
94-95
Table 1
Distribution amongst the ILL member countries of beamtime requests and allocation in the April 2018 panel meeting. Proposals from purely non-member countries do not appear in this table, and therefore the total requests and allocations are different in Table 2.
Request days
Request %
Allocation days
Allocation %
Allocation days
Allocation %
Member countries only
Before national balance
After national balance
AT
79.96
2.30
49.78
2.93
51.13
3.01
BE
24.3
0.70
12.43
0.73
9.43
0.56
CH
128.51
3.69
57.71
3.39
35.14
2.07
CZ
21.91
0.63
9.29
0.55
9.43
0.56
DE
837.48
24.07
395.10
23.22
394.32
23.24
DK
101.02
2.90
35.99
2.12
36.74
2.17
ES
158.62
4.56
88.55
5.20
97.45
5.74
FR
844.69
24.27
447.29
26.29
448.33
26.43
GB
708.31
20.35
348.07
20.46
357.12
21.05
IT
264.21
7.59
150.05
8.82
150.09
8.85
PL
95.08
2.73
39.57
2.33
39.58
2.33
SE
193.78
5.57
61.45
3.61
61.85
3.65
SK
21.94
0.63
6.22
0.37
5.87
0.35
Total
3 479.81
100.00
1 701.50
100.00
1 696.50
100.00
In calculating the statistics for beamtime per country shown in Table 1, attribution is based on the location
of the laboratory of the proposers, not their individual nationality. For a proposal involving laboratories from more than one member country, the total number of days is divided amongst the collaborating countries and weighted by the number of people from each. Local contacts are
not counted as proposers. The beamtime requested by
and allocated to scientists from the ILL is allocated to the member countries according to a weighting system based on the fractional membership of the country of the institute concerned. When a proposal involves collaboration with a non-member country, the allocated time is attributed entirely to the collaborating member countries. Proposals in which all proposers are from non-member countries therefore do not appear in this table.
Table 2 gives a summary of instrument performance
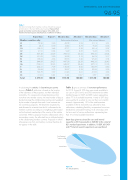
for 2018. Around 4 250 days were made available to our users in 2018 on ILL and CRG instruments (via either standard request or EASY and DDT routes), representing about 77 % of available beamtime. A total of 297 days were used by ILL scientists to carry out their own scientific research. Approximately 13 % of the total beamtime available on the ILL instruments was allowed for tests, calibrations, scheduling flexibility, recuperation from minor breakdowns and student training. In all, 262 days were lost as a result of various malfunctions, representing less than 5 % of total available beamtime.
Beam days given to science (for users and internal research) in 2018 amounted to 4 548 (82 %) for a total of 821 standard experiments. In addition, 18 DDT, 63 EASY and 79 internal research experiments were perfomed.
Losses
Test/Training/ Commissioning
Internal time
Figure 4
Use of ILL beamtime.
Users
www.ill.eu
