
Page 96 - ILLS Annual Report 2018
P. 96
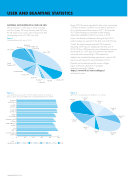
 USER AND BEAMTIME STATISTICS
NATIONAL AFFILIATION OF ILL USERS IN 2018
The ILL welcomed 1 597 users in 2018, including 442 from France, 233 from Germany and 207 from the UK. Many of our visitors were received more than once (making a total of 2 336 user visits).
During 2018 the reactor operated for three cycles, representing 158 days of neutrons. As the ILL was not able to operate two of its originally planned three cycles in 2017, the November 2017 panel meeting was cancelled and the backlog experiments scheduled for the first two cycles in 2018.
Hence, the allocation of beamtime during the April 2018 panel meetings was restricted to the third cycle of 2018 only.
Overall, the panel meetings examined 537 proposals requesting 3 499 days for scheduling in the third cycle of 2018. Of these, 308 proposals received beamtime, requiring the allocation of 1 697 days of beamtime on the different instruments and corresponding to 338 experiments.
Added to the scheduled backlog experiments, a total of 821 peer-reviewed experiments were scheduled in 2018.
Figure 1
National affiliation of ILL users in 2018.
 Austria 31 Others 274
United Kingdom 207
Belgium 8
Czech Republic 22
 Denmark 47
 Switzerland 46
Sweden 83
Proposals are divided amongst the various colleges. Figure 3 shows the distribution of accepted proposals amongst the colleges (https://www.ill.eu/users/colleges/)
and research areas.
Figure 3
April 2018: accepted proposal distribution over colleges.
Spain 82
Slovakia 9
Poland 24
Italy 89
Germany 233
France 442
 Figure 2
User satisfaction survey results for 2018 compared with those obtained in previous years. The user feedback rate was approximately 60 % in 2018.
Instrument performance
Scientific assistance
Technical assistance
Sample environment
Instrument control software
Data reduction/ analysis
User support
Accommodation and food
User satisfaction (%)
College 9 21 %
College 8 11 %
College 1 6 %
College 7 7%
College 3 10 %
College 6 3 %
College 4 9%
College 5B 24 %
College 5A 9%
                                                                          0 20 40 60 80 100
2011 2012 2013 2014 2015 2016 2017 2018
        ANNUAL REPORT 2018
