
Page 33 - ILLS Annual Report 2018
P. 33
SCIENTIFIC HIGHLIGHTS
30-31
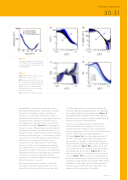
Figure 2
Comparison between contrast variation of 120 and 12 nm silica nanoparticles in segmented flow, continuous flow and discrete approach.
Figure 3
a) Raw data from the dilution of Ludox HS-40 from 13.05 to 1.4 %.
b) Normalisation of the dilution set by the concentration of nanoparticles, after having removed the high-q background.
c) Structure factor, calculated as (b) divided by the form factor, measured from the dilute system.
d) Constrained fit of the dilution series.
appropriately to increase the counting time within a finite experimental timeframe. Significantly, operating this system with feedback enables rapid decision- making, e.g. to seek phase boundaries or refine a parameter of interest (such as a match point). The set-up is composed of a crown glass microfluidic chip, in which typically two aqueous solutions are injected at controlled flow rates (see figure 1). By changing the relative flow rates, different samples are formulated. By injecting a third stream, of a water-immiscible oil, it is possible to create a segmented flow and thus eliminate the effect of axial dispersion, i.e. the ‘smearing’ of fluid composition over time. The adaptive liquid formulator then becomes a conveyor belt of distinct mixture compositions. As the plugs reach the neutron beam footprint, typically over-illuminating several channels, the scattered intensity is recorded and a composition assigned to that spectrum. By using a semi-transparent beamstop, the data can be (simultaneously) calibrated in absolute units and, by triangulating the input composition, incoherent background and transmission, data self-consistency is ensured.
Following an optimisation procedure, we selected fluorinated oils as the immiscible phase, due to the immiscibility with water and low neutron signal and
cost. The paper reports on a comparison between the continuous approach (single-phase flow), the segmented flow and the standard, discrete approach in figure 2, and establishes the conditions to which each method is best suited in terms of system of interest, availability of the material and required experimental time.
Furthermore, we applied droplet microfluidic-SANS
to study the dilution of a suspension of 12 nm silica nanoparticles (Ludox HS-40) in water. We produced solutions ranging from 13.05 to 1.4 (v/v) % nanoparticles in water and recorded 120 scattering patterns in
120 steps (figure 3a), for a total experiment time of
10 mins. Two analysis approaches are proposed: on
the one hand, it is possible to remove the background and normalise the scattering pattern by the concentration of the nanoparticles (figure 3b) and then divide each curve by the form factor (measured for the dilute system), thus obtaining the structure factor (figure 3c); on the other, one can perform a constrained fit on the entire set of curves (figure 3d), thus achieving unprecedented precision in determining the unknowns of the system. The availability of large datasets in microfluidic-SANS enables simultaneous, constrained, data fits which significantly improve accuracy by effectively providing many ‘more equations for the same number of variables’.
www.ill.eu
