
Page 31 - ILLS Annual Report 2018
P. 31
SCIENTIFIC HIGHLIGHTS
28-29
In order to determine the fine structures of P- or
M-helical 2oct, dilute solutions of 2oct in THF-d8 or a 1,1,2-TCE-d3/THF-d8 mixture (8/2) in quartz cells
were studied using SANS measurements at 313 K. Remarkably, clear scattering peaks were observed in the high-q region (0.2 Å–1 < q < 0.7 Å–1), allowing the elucidation of the fine structure of the polymer including the conformation of the side chains through simulation of the SANS patterns. It should be emphasised that neutron scattering was crucial to revealing the detailed structures of 2oct because the peaks in the high-q region originate from the difference in neutron scattering length densities between the side chains and the backbone, which cannot be distinguished by small-angle X-ray scattering.
For the simulation of the SANS patterns, we carried out
a conformational analysis of 2oct. Initially, conformers of
a model for the repeating unit of 2oct were generated
and optimised by molecular mechanics calculations. After connecting the conformers of the model for the repeating unit, the theoretical models of P- or M-helices of 2oct were further optimised for the simulation of the SANS patterns. SANS patterns corresponding to the 20 macromolecular models were calculated by assuming a random orientation of the molecules in consideration of the solvents, and compared with the experimentally obtained SANS pattern in THF-d8 or the 1,1,2-TCE-d3/THF-d8 mixture (8/2).
Finally, we obtained P- and M-helical models showing good agreement with the observed SANS patterns of
2oct in THF-d8 and the 1,1,2-TCE-d3/THF-d8 mixture (8/2) (figures 2a and 2b). In order to visualise the solvated structures of P- and M-helical 2oct, solvent-excluded
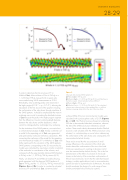
Figure 2
Observed and simulated SANS patterns for
a) P-helical 2oct in THF-d8, and
b) M-helical 2oct in 1,1,2-TCE-d3/THF-d8 (8/2), with fitted lines in the Guinier region. Solvent-excluded surfaces (SESs) of
c) P-helical 2oct in THF-d8, and
d) M-helical 2oct in 1,1,2-TCE-d3/THF-d8 (8/2). The calculated surfaces were coloured using a colour gradient (blue → red) that illustrates increasing distance from the axis of the main chain.
surfaces (SESs) of the two macromolecular models were calculated with a probe sphere radius of 2.0 Å (figures 2c and 2d). The P-helical structure showed an undulating SES due to the extended side-chain orientation, whereas the SES of the M-helical structure exhibited a smooth surface. These results clearly demonstrate that the P-helical structure is well solvated while the M-helical structure is less solvated, i.e. solvation plays a crucial role in determining the conformation of the side chains and, consequently, the macromolecular helical chirality.
These results reveal that the accumulation of small
energy differences in the solvation of the chiral side chains altered the conformation of the two chiral side chains per repeating unit, resulting in absolute control over the macromolecular helical chirality. This is the first demonstration of the effect of solvation of chiral side chains on the helicity of the main-chain conformation of helical macromolecules. Given that the side-chain-based strategy is widely applicable not only to macromolecular systems but also to supramolecular architectures, this study should accelerate the design of a wide range of new chirality-switchable helical molecular systems.
www.ill.eu
