Example 2
Small Angle Diffraction & SANS 'Crystallography'
e.g. D22: D. McK. Paul 5-42-63 - Flux Line (Vortex) Lattice in Rare-Earth Borocarbide Superconductors
Aims
- High resolution SANS measurements
- Lattice structure, orientation and morphology
- Rocking curves and integrated intensity of Bragg peaks
- 2D Curve fitting
Experiment Overview
- Instrument: D22 (2001)
- Detector distance of: 17.6m
- Collimation distances of: 17.6m
- Wavelength: 10 angstroms
- Additional Entrance Aperture: Att 6 (20mm)
Vortex Lattice Scattering Measurements (T < Tc) @4.2K
| Rocking Curve Foreground:Sample Angle from -1oto 1o, step 0.1o |
|---|
#88144 : #88164 (21 files) |
Background Measurements (T>Tc) @15K
| Rocking Curve Background:Sample Angle from -1oto 1o, step 0.1o |
|---|
#88526 : #88526 (21 files) |
Download: Example 2
Option 1:
Grasp Project with all data worksheets filled and derived beam centres and transmission values calculated as described above (needs unzipping first).
ex2_project.zip
Option 2:
A 'zip' of all the individual data files described above. Download and unzip the raw data ready to load into Grasp.
ex2_data.zip
Data Reduction and Analysis Overview
Filling the data worksheets:
- Launch Grasp. Switch to the D22 128ASCII instrument configuration in the menu: Instrument > ILL > D22_128ASCII.
- Set the data directory where the raw data can be found: File > Set Data Directory or File > Set File & Data Directory (choose any file, it doesn't matter).
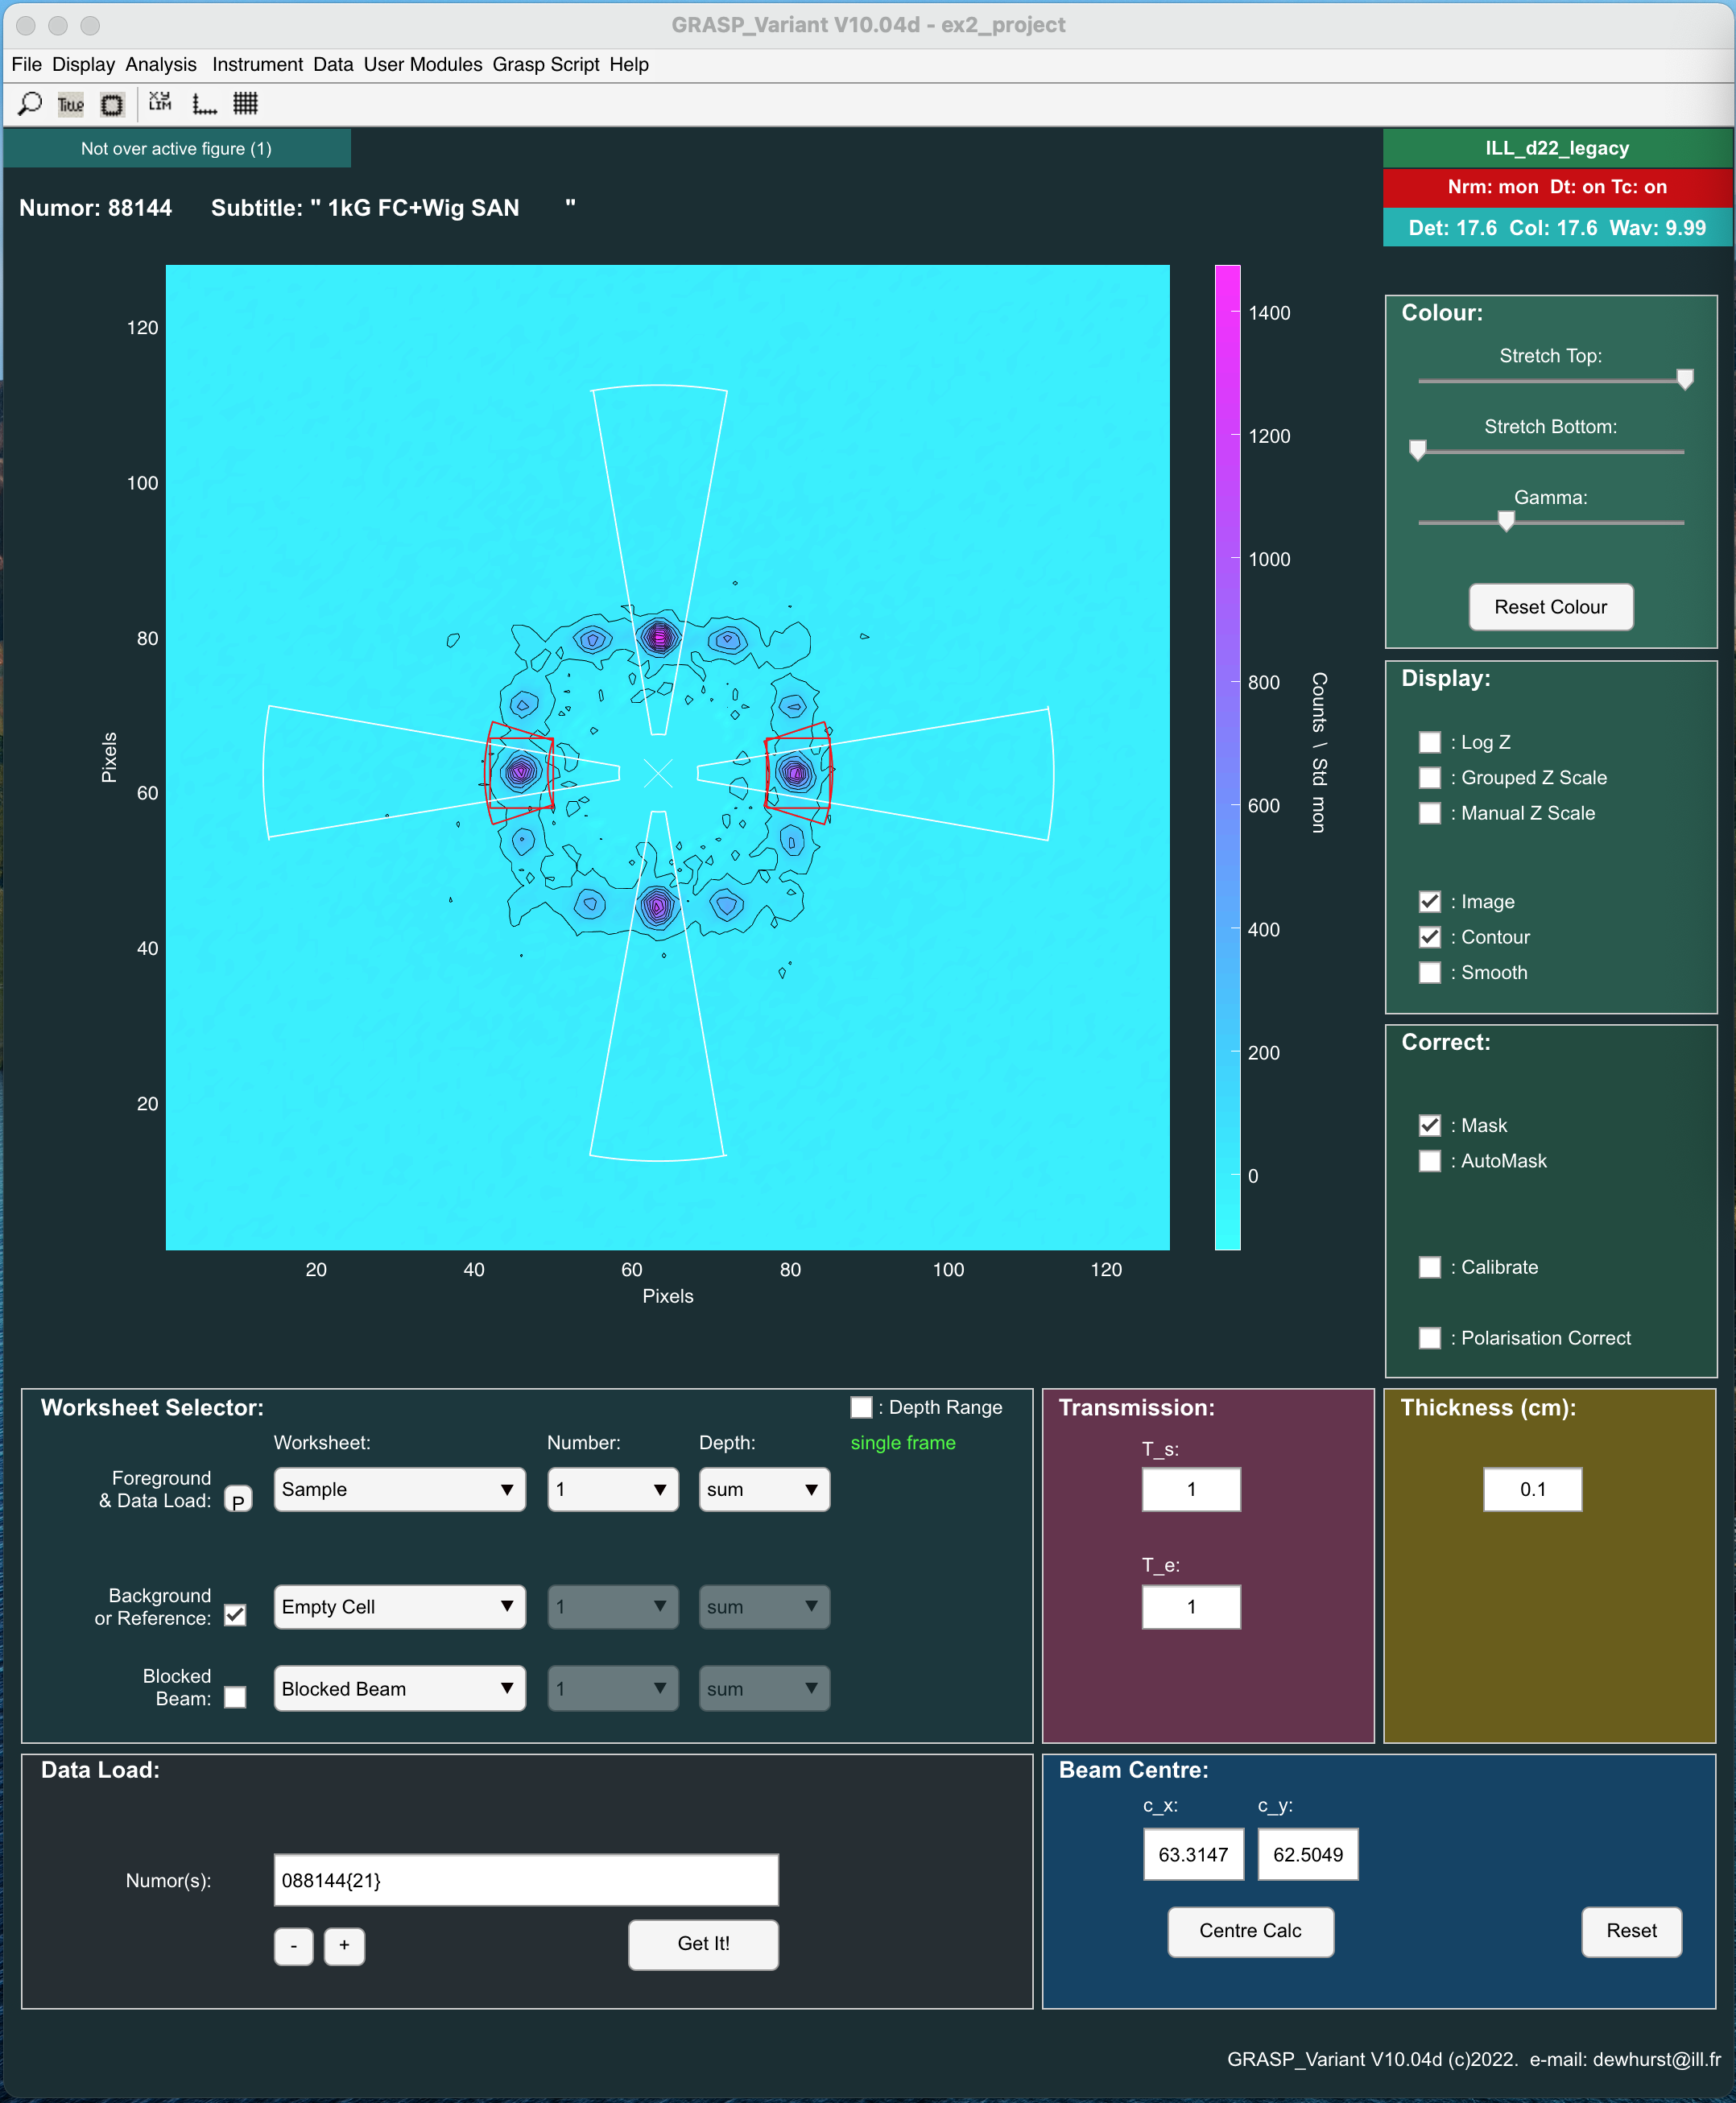
- Load the sample scattering data (Vortex lattice from the superconductor with T < Tc) into the Worksheet 'Sample 1'.
- In the Worksheet Selector, make sure that 'Sample' and number '1' is selected in the Foreground & Data Load selector.
- Enter the run number(s) into the 'Data Load, Numors' box and click the 'Get It' button: e.g. '88144:88164'. This loads all 21 files of the vortex lattice scattering data measured at sample angles between -1o and 1o into the 'Depth' of Worksheet Sample 1: Depths 1,2,3.....21. Note: Sequentially numbered data could have equivalently been loaded as '88144{21}' or as a comma separated list '88144, 88145, 88146 .....' for a non sequential sequence of data. Hold the mouse hovering over the 'Data Load, Numors' box for tips on more data loading options.
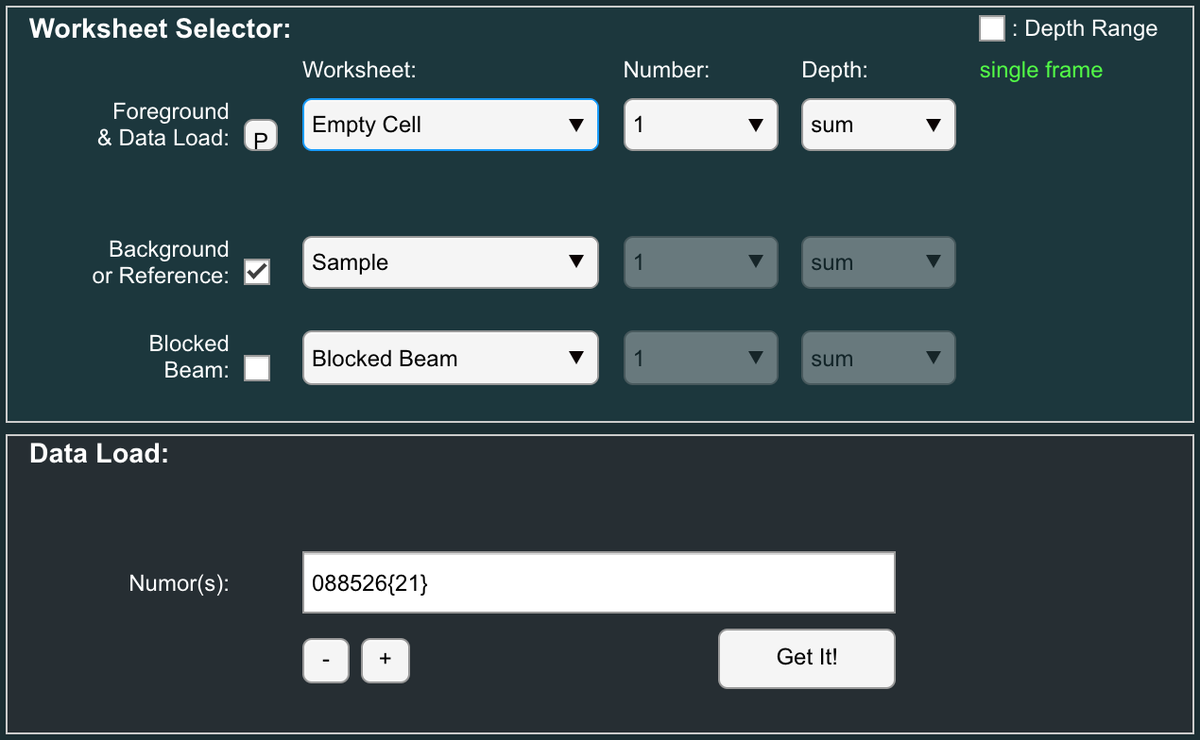
- Load the background scattering (Scattering from the superconductor crystal with T > Tc) into the Worksheet 'Empty Cell 1'.
- Select 'Empty Cell' and number '1' in the 'Foreground & Data' Load selector.
- Enter the run numbers(s) into the 'Data Load, Numors' box and click the 'Get It' button: e.g. '88526:88546' or equivalently '88526{21}'. This loads all 21 files of the background scattering data measured at sample angles between -1o and 1o into the 'Depth' of Worksheet Sample 1: Depths 1,2,3.....21.
View and Inspect Background Corrected Scattering from the Vortex Lattice
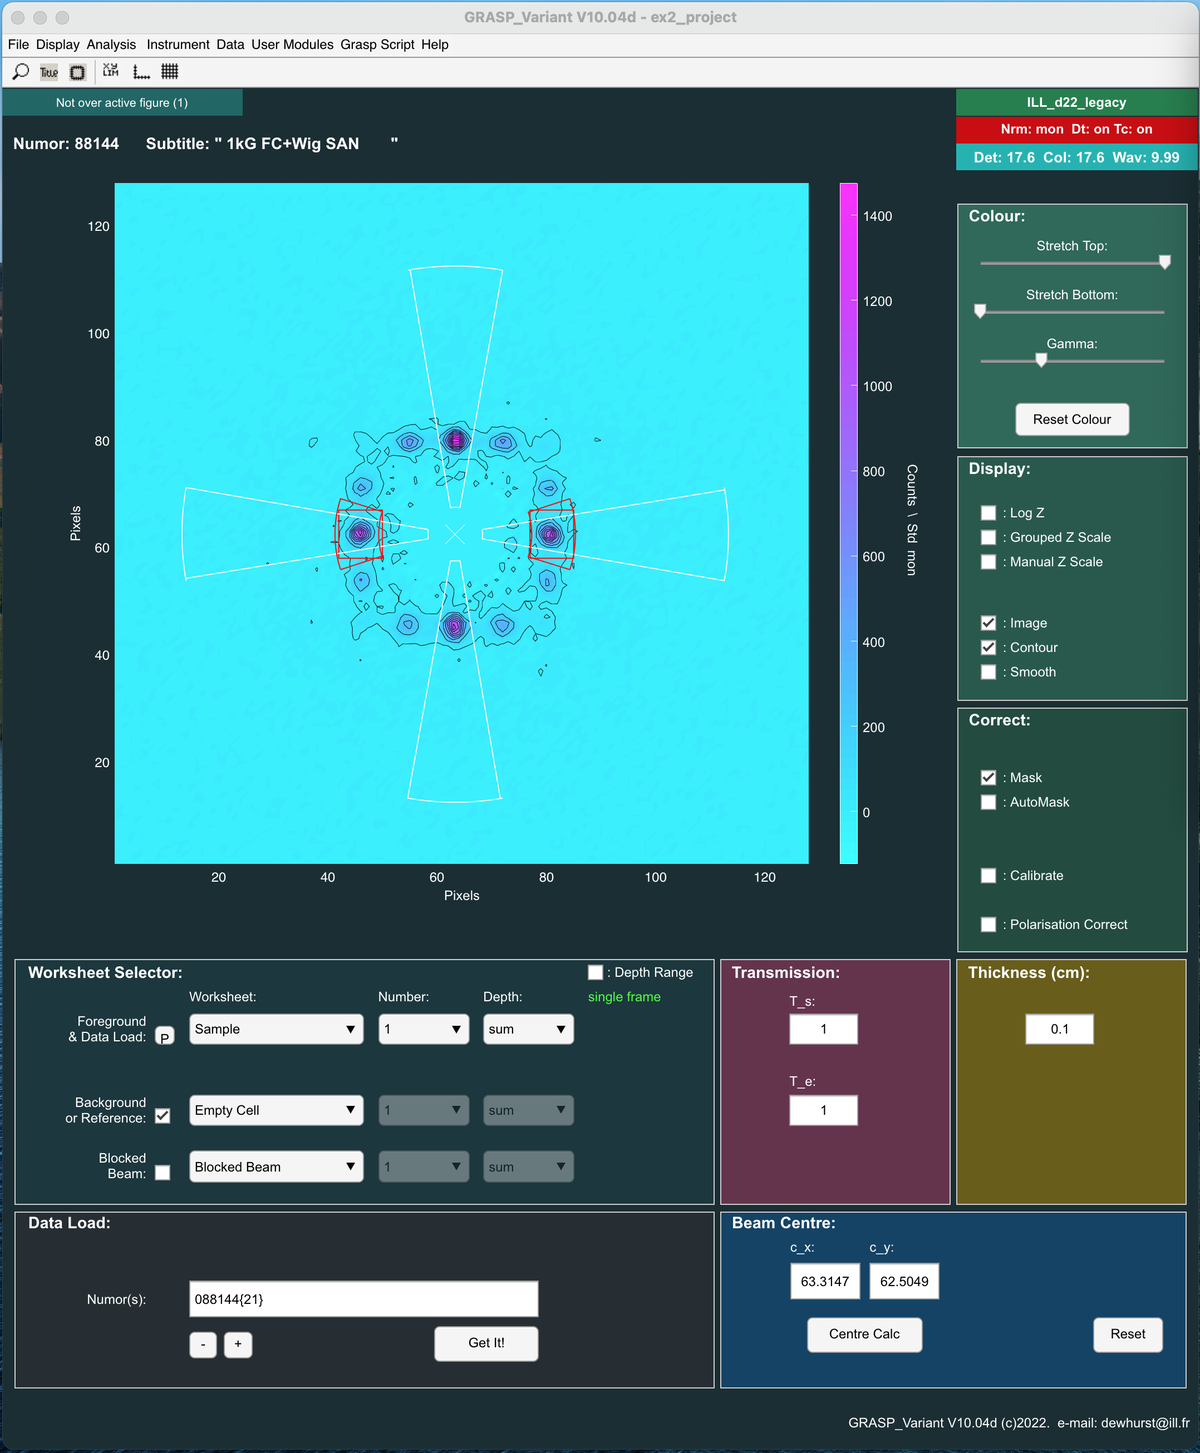
- In the Worksheet Selector, make sure that 'Sample' and number '1' is selected in the Foreground & Data Load selector.
- Click the check box to the left of the Background worksheet selector to enable subtraction of the background from the vortex lattice scattering data.
- Apply the Background correction by ticking the check box to the left of the Background worksheet selector.
- Use the worksheet 'Depth' delector to toggle between subtracted 2D data as a function of sample angle.
- Use the various Display and Analysis tools to:
- Modify the 2D visual display: e.g. Colour scheme, Contour, Smoothing, Log intensity scale, (un)Grouped intensity scale between panels, Manual intensity scale etc.
- Analysis tools allow defining various regions of the detector to be considered for analysis / reduction: e.g. Sectors, Boxes, Strips etc.
What about sample Transmission?
In this particular case there is no difference in the material in the beam between the sample (vortex lattice) and background scattering measurements. As such, the relative transmission between sample and background can be considered to be equal to T_s = 1. In such a case it is of no consequence to measure a blocked beam scattering measurement as this contribution would be exactly removed in the subtraction of background from sample scattering. T_e is irrelevant and can also be left as T_e = 1.
What about a Direct Beam measurement: Beam Centre? Absolute Intensities?
In principle a measurement of the direct beam will have been made along side the taking of this data. This is useful for:
- Any final quantitative calculations of absolute intensities and superconductivity parameters derived from the scattering cross-section (e.g. Form Factor).
- Measurement of the beam centre - i.e. the centre of radial symmetry of the scattering pattern.
- A direct measurement of the angular resolution of the instrument (beam image angular size in 2D)
However - I do not have a measured direct beam at hand BUT I need the beam centre.
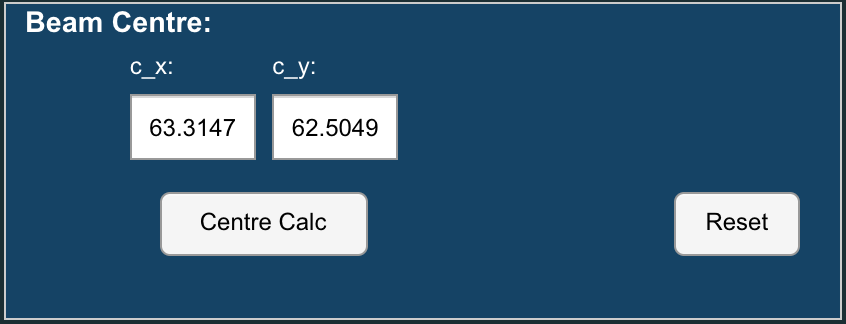
- Given the symmetry of the SUM of the (background subtracted) scattering pattern one approximate solution would be simply to click 'Centre Calc' for the entire image to calculate the centre of mass of the image.
- A more precise ...and rather neat solution is demonstrated below by making 2D fits to equivalent Bragg peak positions and using the Vortex Lattice user modules to estimate the beam centre from the fitted spot positions.
- For now we will continue with the beam centre calculated below as Cx = 63.31, Cy = 62.50. This could be entered manually in the Beam Centre panel.
Data analysis example: Approximate Bragg peak position: I vs. |q|
- Open the 'Averaging: Radial & Azimuthal' window from the 'Analysis > Averaging: Radial & Azimuthal' menu (shortcut CTRL-R [Windows/Linux], CMD-R [Mac]).
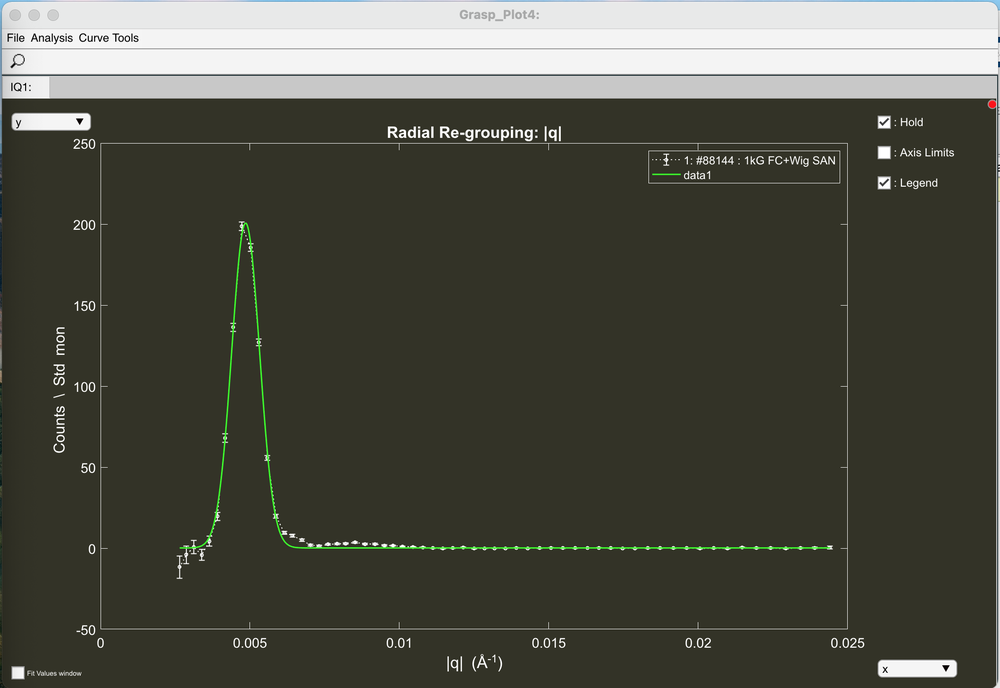
- Make sure the worksheet selector in the main Grasp window is set to 'Sample 1 Sum'. i.e. the sum of all worksheets in the depth is displayed. This is the sum of the rocking curve of the Bragg peaks.
- Click the 'I vs. |q|' button to make a 1D isotropic reduction of the displayed data.
- Note: The radio buttons 'Single', 'Depth', 'TOF' allow automatic averaging of data though the worksheet depth.
- In this case select 'Single' to make the I vs. |q| average for the sum of the rocking curve, as displayed on the main Grasp 2D display.
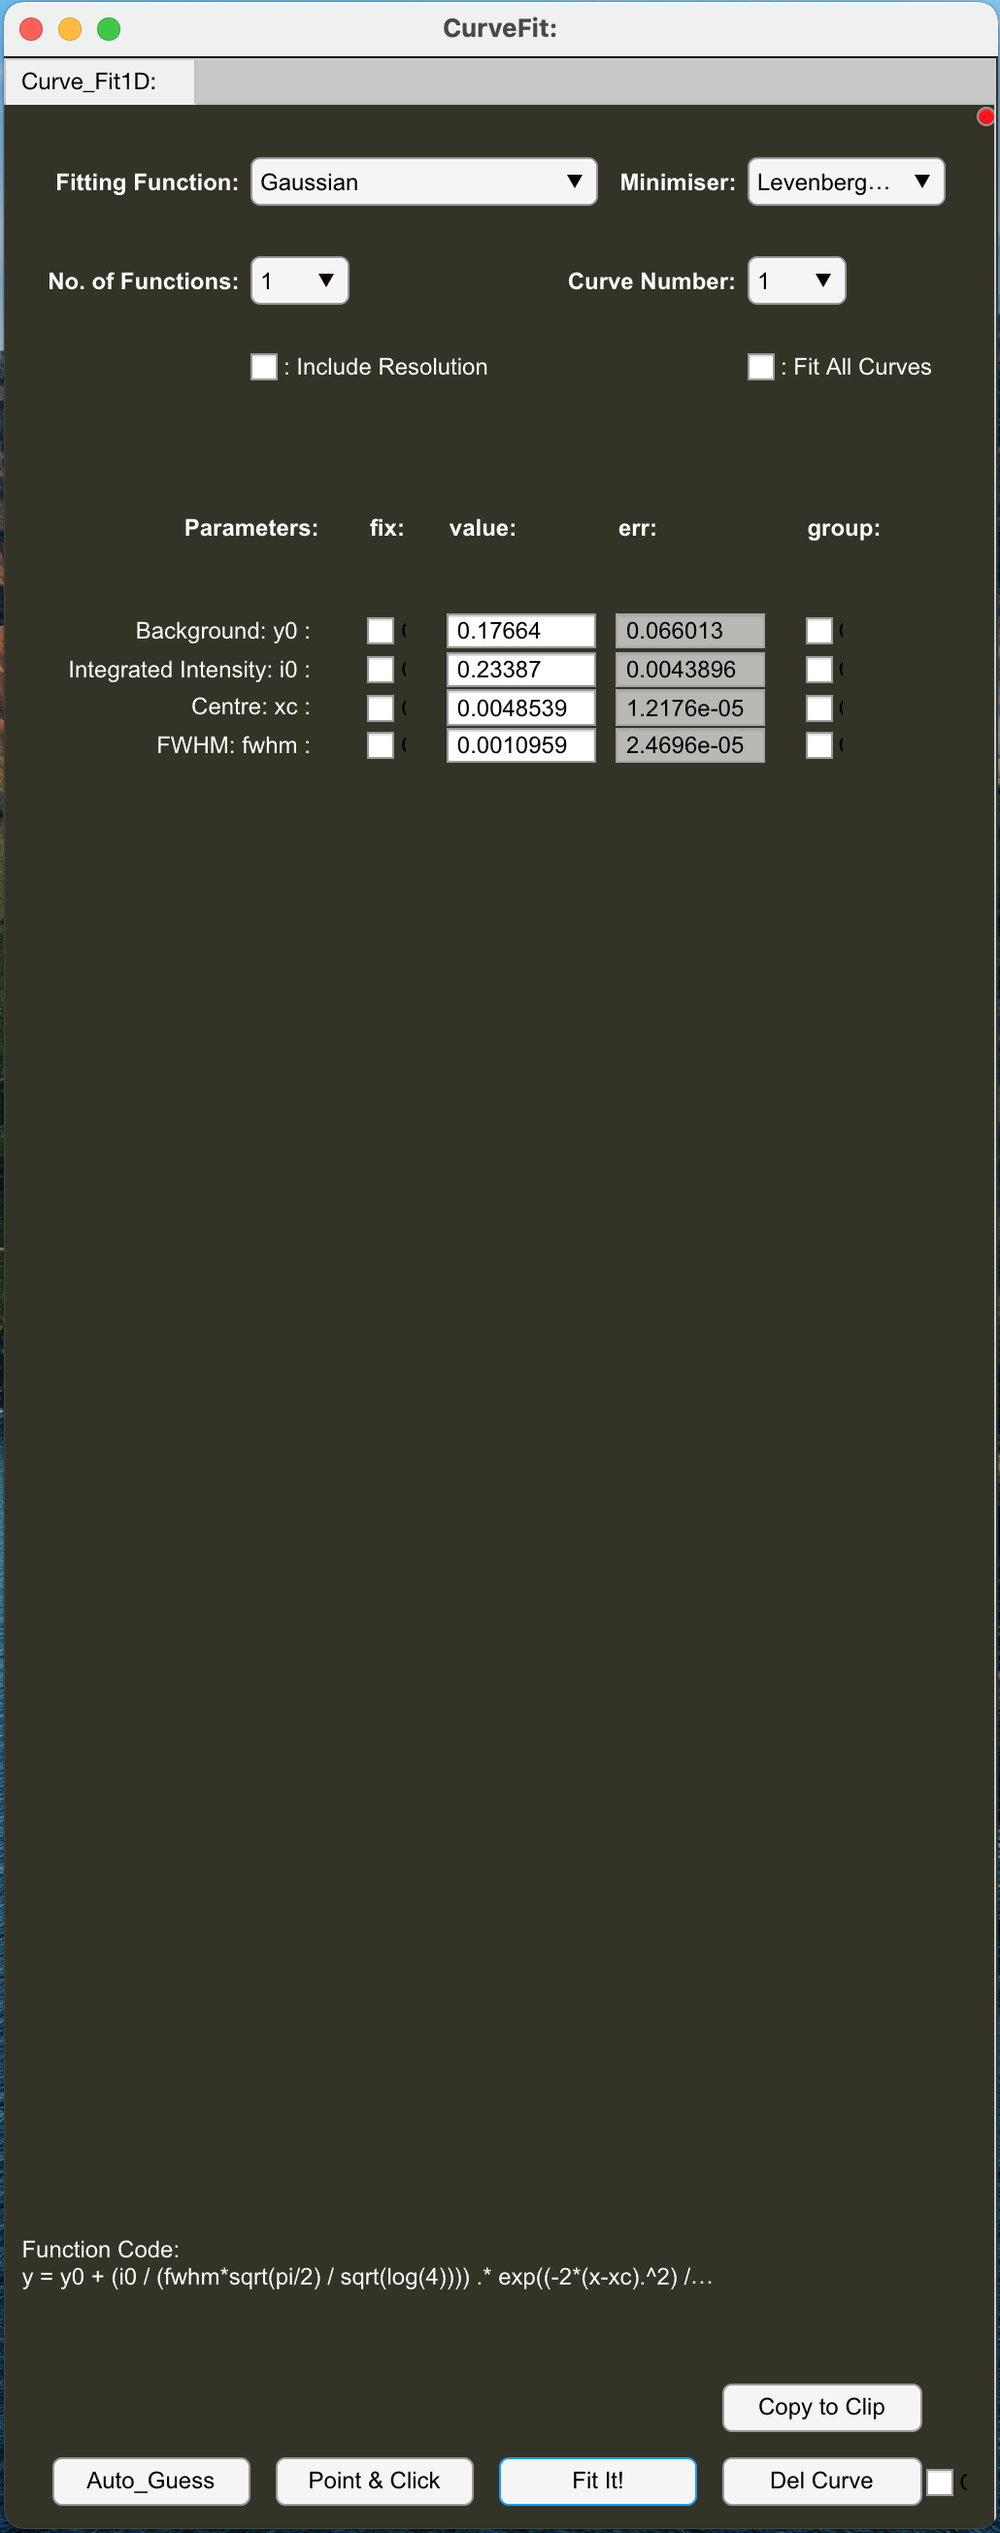
- Open the 1D Curve Fitting window from Grasp_Plot 'Analysis > Curve Fit' menu
- Select a Gaussian fitting function.
- Click the 'Auto Guess' button.
- Click 'Fit It!' to complete the curve fit and view the fitted parameters. The Bragg peak lies at a peak position of q = 0.0048539 Å-1
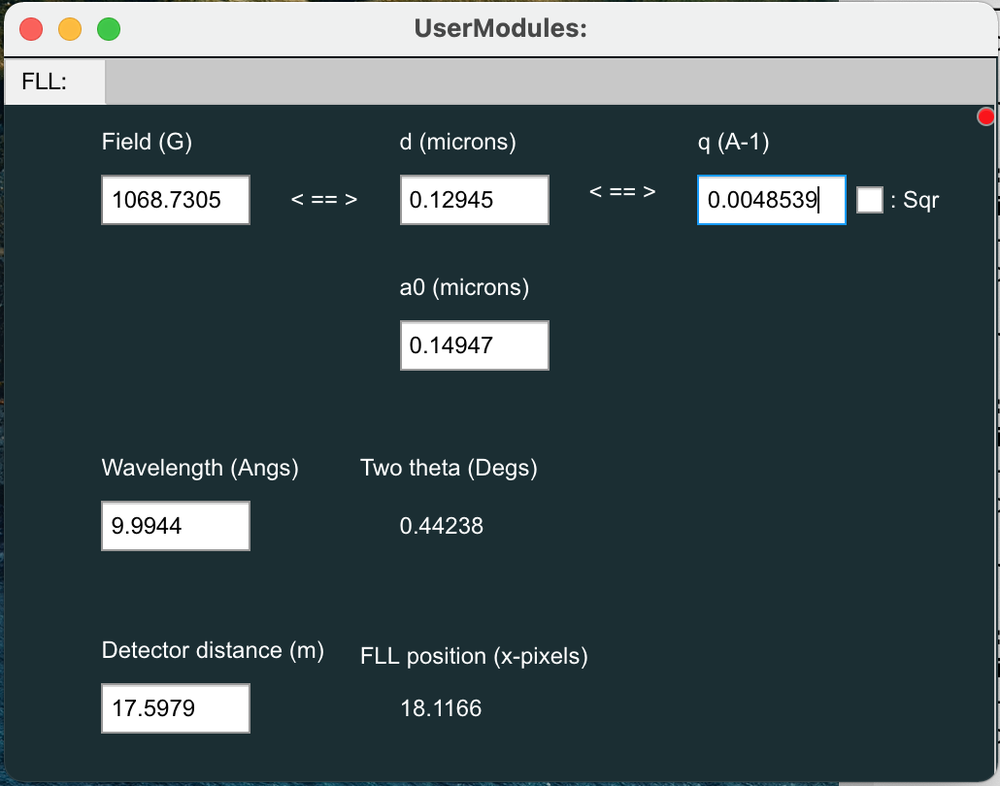
- In this example for Bragg diffraction from the vortex lattice in a superconductor, the q-value , is determined by the spacing of the vortex lines which itself is determined by the internal magnetic field value.
- Open the 'User Modules > Vortex > FLL Window' from the main Grasp menu and calculate the internal magnetic field from the fitted q-value (copy and paste the fitted q-value from the Curve Fit window into the FLL window). I calculate a value of 1069 Gauss (106.9 mT).
Data analysis example: A better analysis of the Vortex Lattice Structure: I vs. |q| using Sectors
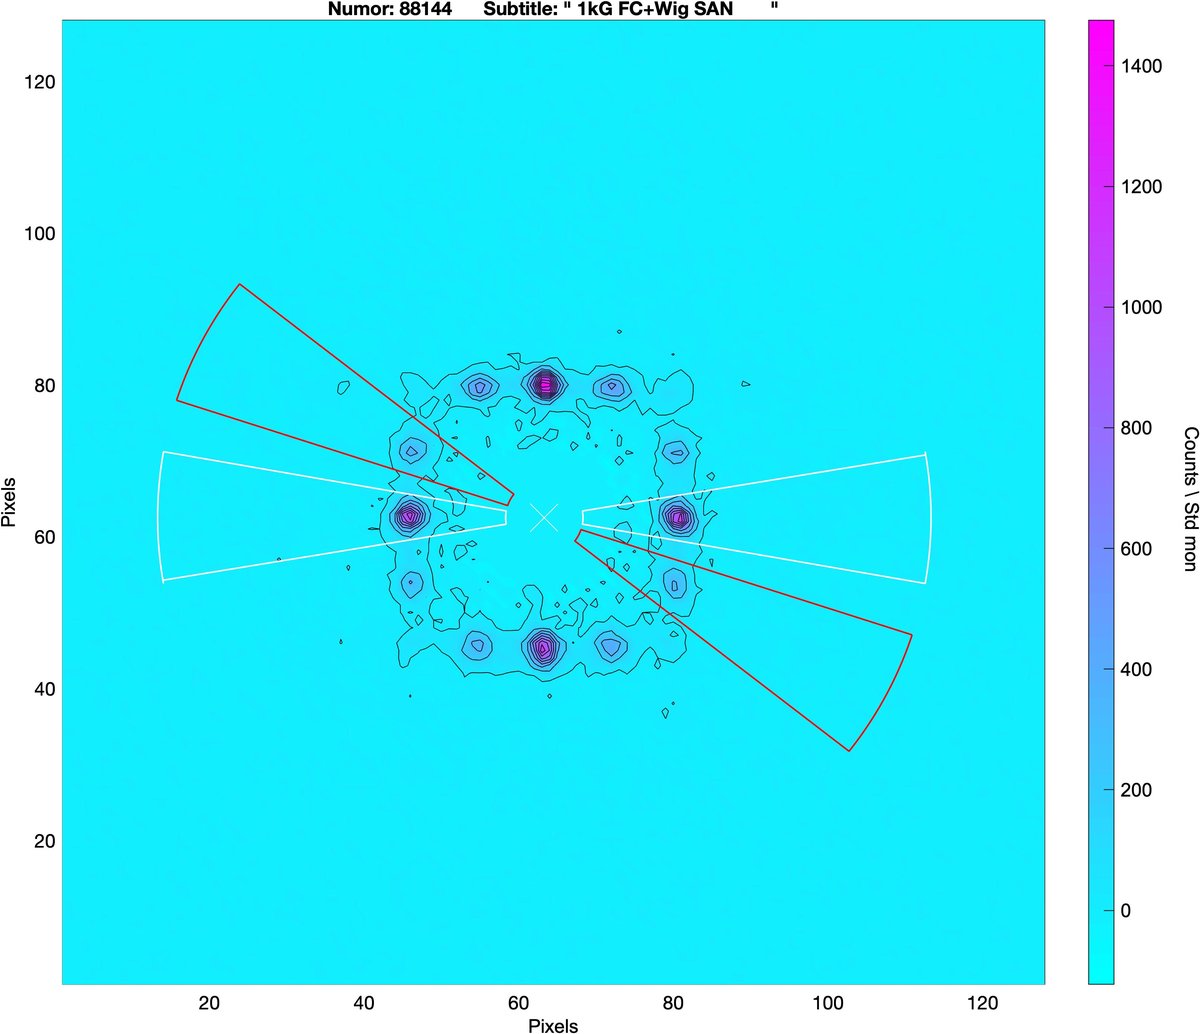
- The Vortex Lattice is not isotropic or single domain. In fact it consists of two types of rhombic VL domains oriented at 90o from each other (https://journals.aps.org/prb/abstract/10.1103/PhysRevB.72.014542).
- You can measure the q-value of the various peaks accurately by taking the I vs |q| using sector(s) over the appropriate Bragg peaks.
- Open the 'Sectors & Ellipses' window from the 'Analysis > Sectors & Ellipses' menu (shortcut CTRL-J [Windows/Linux], CMD-J [Mac]).
- Define your sector(s) of interest over the data: Inner radius, Outer radius, Theta and delta Theta (opening).
- Use Mirror Sectors to define equivalent sectors of a given symmetry.
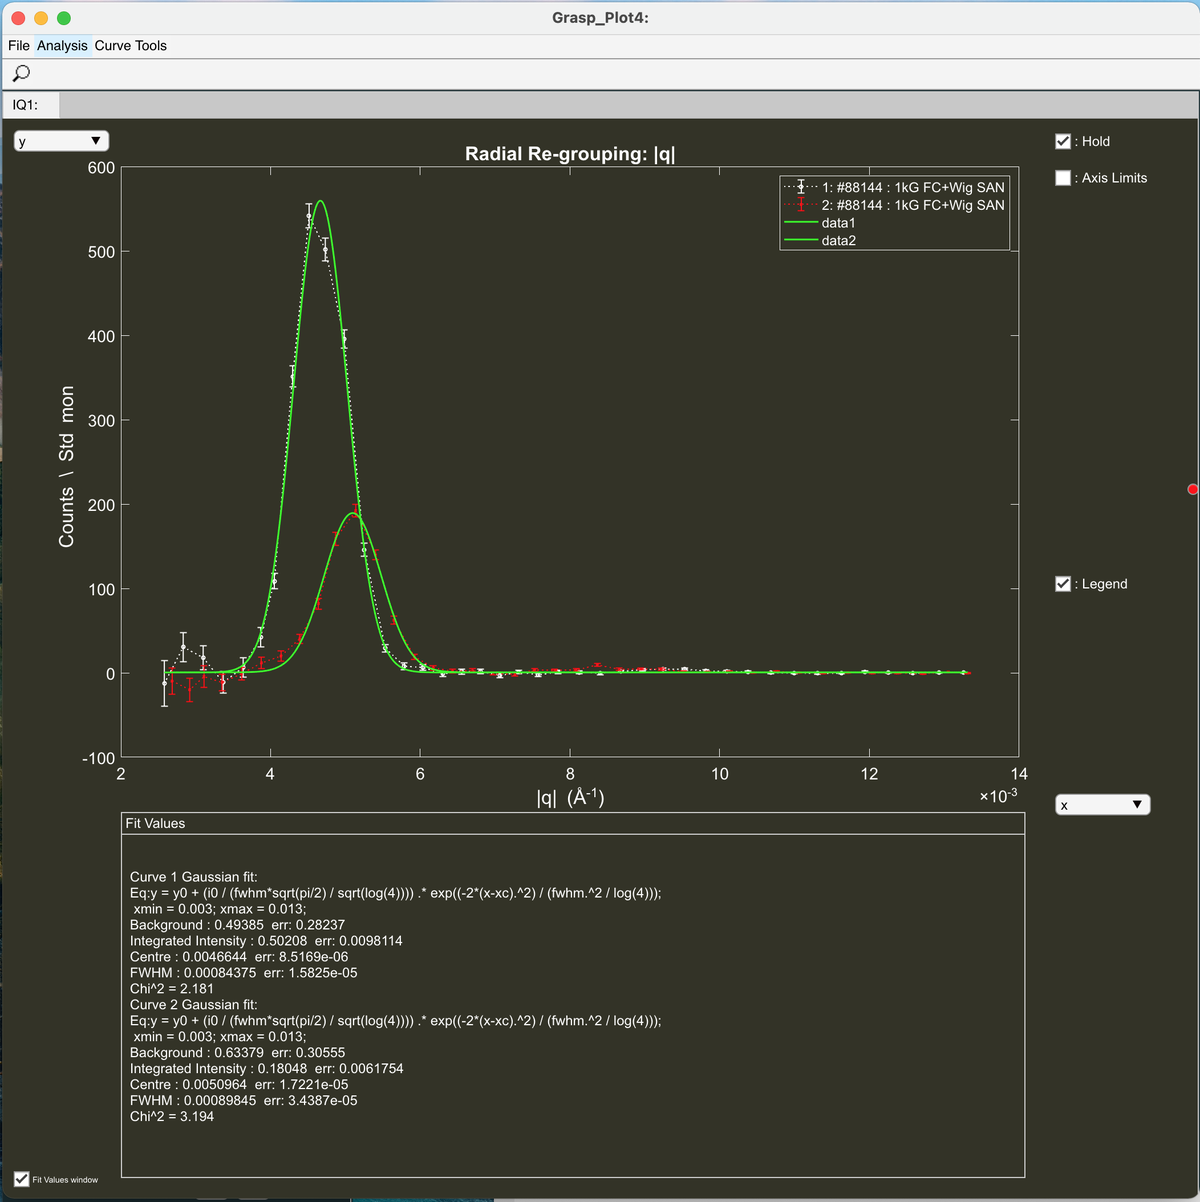
- Click the 'Averaging' button, or return to the Averaging window and ensure that 'Use Sector Mask' is now checked.
- Click the 'I vs. |q|' button to make a 1D isotropic reduction of the displayed data within the defined sector(s)
- Curve fit and extract the (different) q-values for the various peaks.
Data analysis example: Rocking curve width - Intensity of each Bragg peak as the sample is rotated though the Bragg condition
Until now we have only used the Sum of all data loaded into Grasp and have not analysed the individual measurements as a function of sample angle as the vortex lattice is rotated though the Bragg condition.
We now want to extract the 'Rocking Curve'
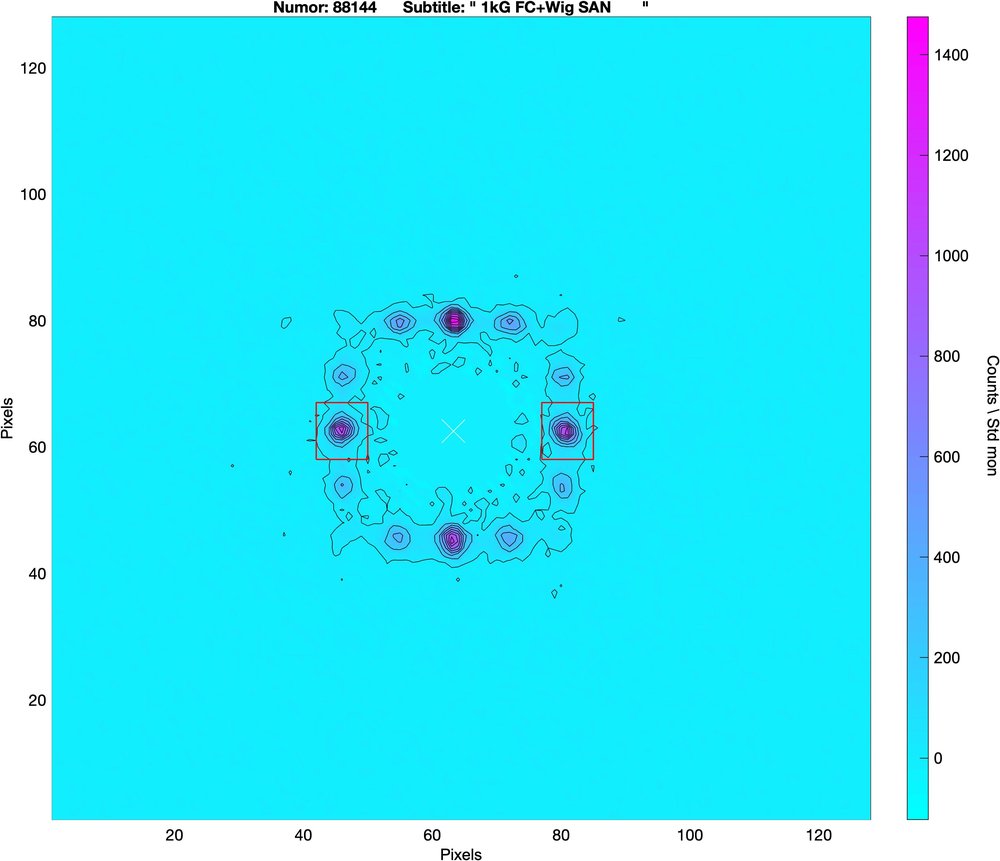
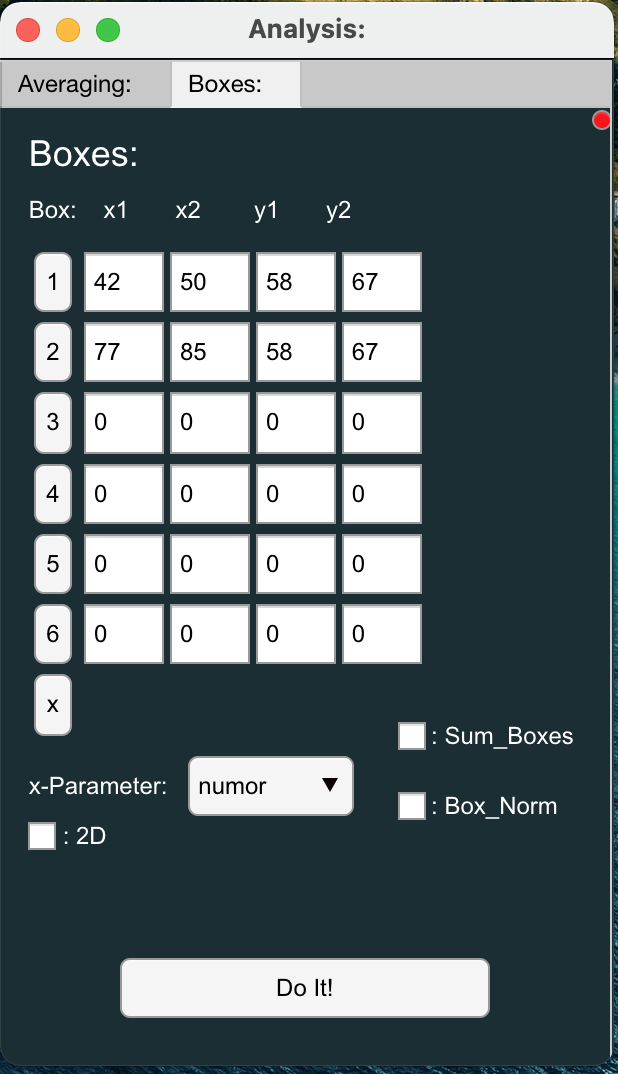
- Open the 'Boxes' window from the 'Analysis > Boxes' menu (shortcut CTRL-B [Windows/Linux], CMD-B [Mac]).
- On the main Grasp display, use the 2D plot inspector tools (top right of the 2D display) to select Zoom and Zoom in around a Bragg peak of interest.
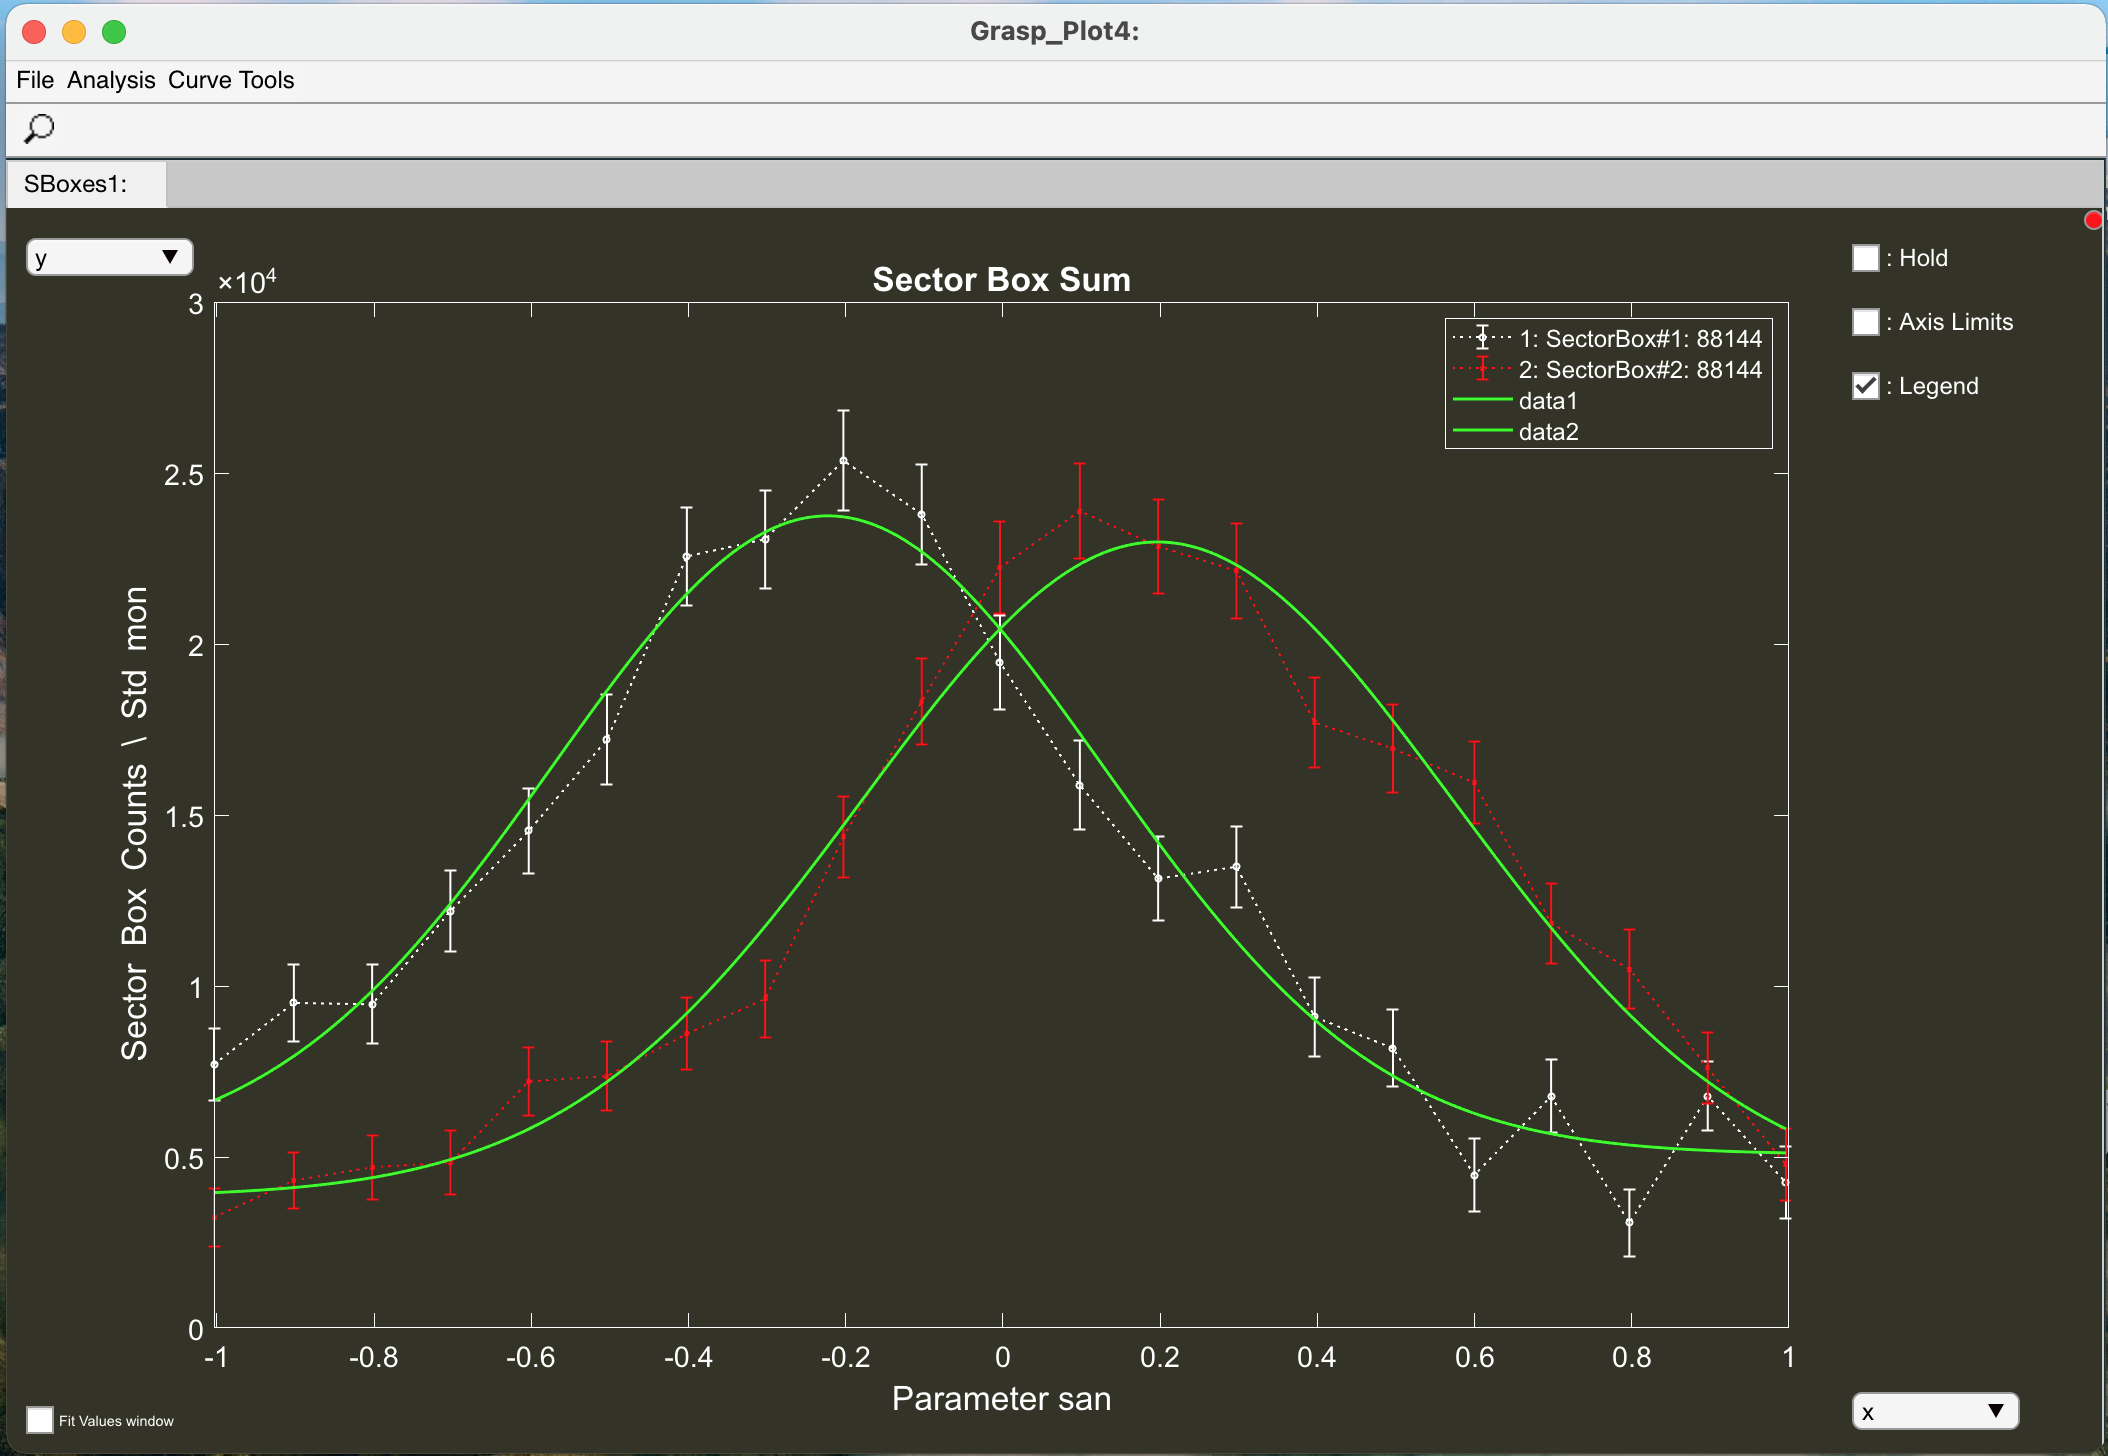
- In the Boxes window, click the box number button to the left of the coordinate boxes to grab the box coordinates. Do this for up to 6 boxes ...here I will grab 2 boxes for the principal peaks on the horizontal axis.
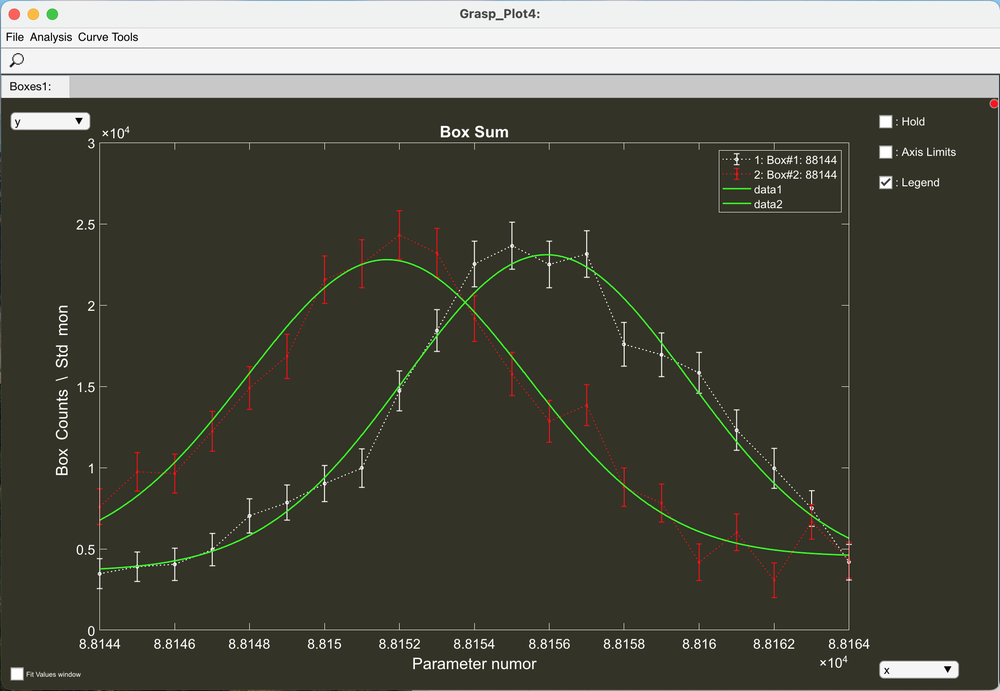
- Select the 'san' x-Parameter using the dropdown menu - This is the sample parameter (san = sample angle) that is changing during the course of the scan.
- Click the 'Do It!' button to extract the integrated scattered intensity within the boxed region(s) as a function of sample angle.
- Use the 1D Curve Fit to fit a Gaussian to the Rocking Curve intensity and extract parameters such as the Integrated Intensity, Peak Centre Angle and Rocking Curve Width.
Data analysis example: 2D Curve fitting to the Bragg peaks
We can work directly with the 2D data in analysis of the vortex lattice structure and determination of physical quantities.
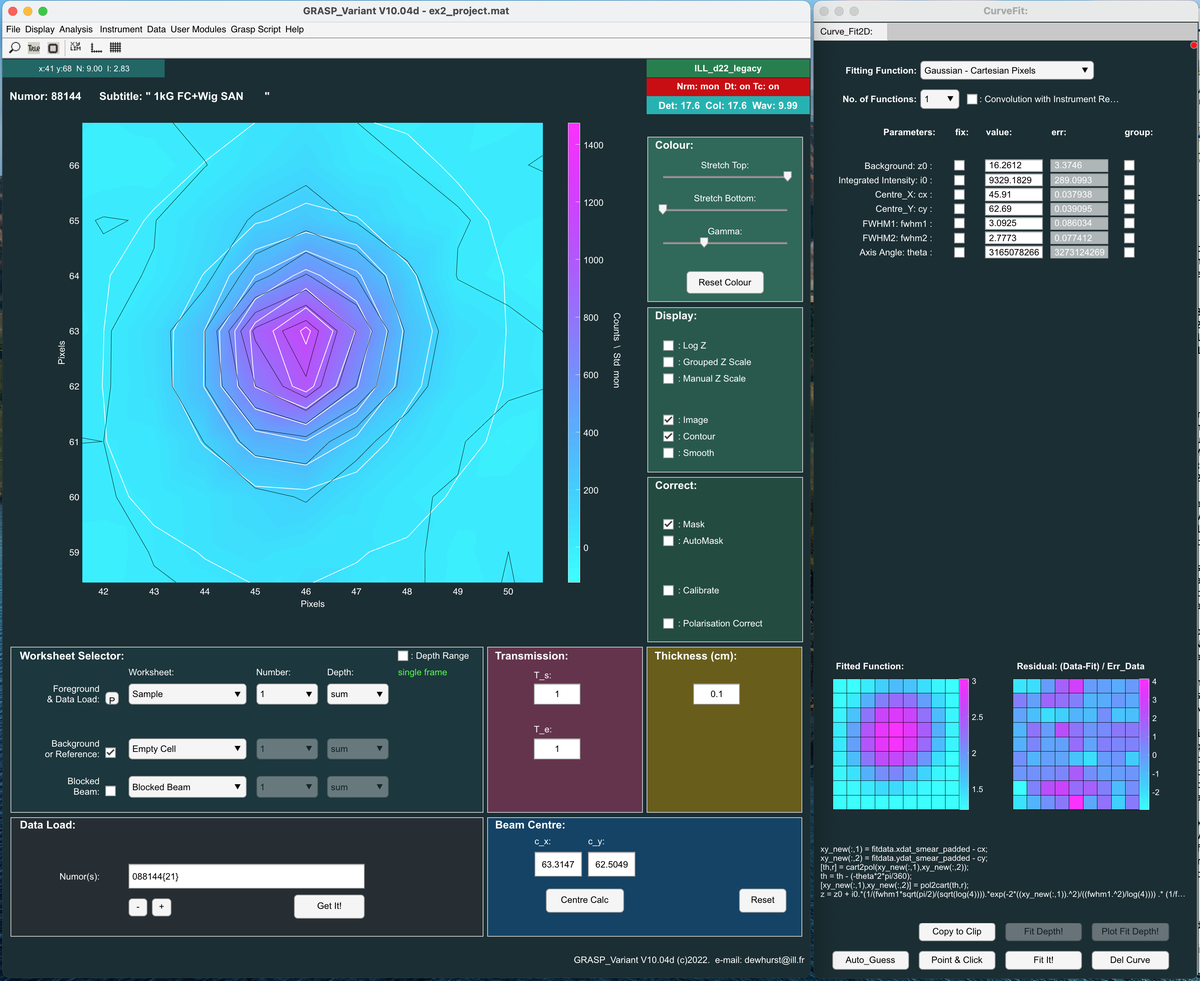
- On the main Grasp display, use the 2D plot inspector tools (top right of the 2D display) to select Zoom and Zoom in around a Bragg peak of interest.
- Open the '2D Curve Fitting' window from the 'Analysis > 2D Curve Fit' menu in the (shortcut CTRL-Q [Windows/Linux], CMD-Q [Mac]).
- Select the required 2D fitting function, in this case 'Gaussian - Cartesian Pixels'.
- Click the 'Auto Guess' button followed by the 'Fit It!' button to perform the fit to the 2D data.
- The resulting fit parameters are displayed in the 2D Curve Fit window
- A graphic representation of the fitted 2D function is shown alongside the residual (difference between the real data and the fit divided by the statistical error in the data).
- Contours representing the fitted function are displayed on the main 2D display on top of the real data.
Use the 2D Curve Fitting and the Vortex Lattice User Modules - Let's find the Beam Centre from the symmtery of the Bragg peaks!
A 'User Module' has been written to calculate the beam centre from the coordinates and pairs of Bragg peaks, assuming a symmetric diffraction pattern.
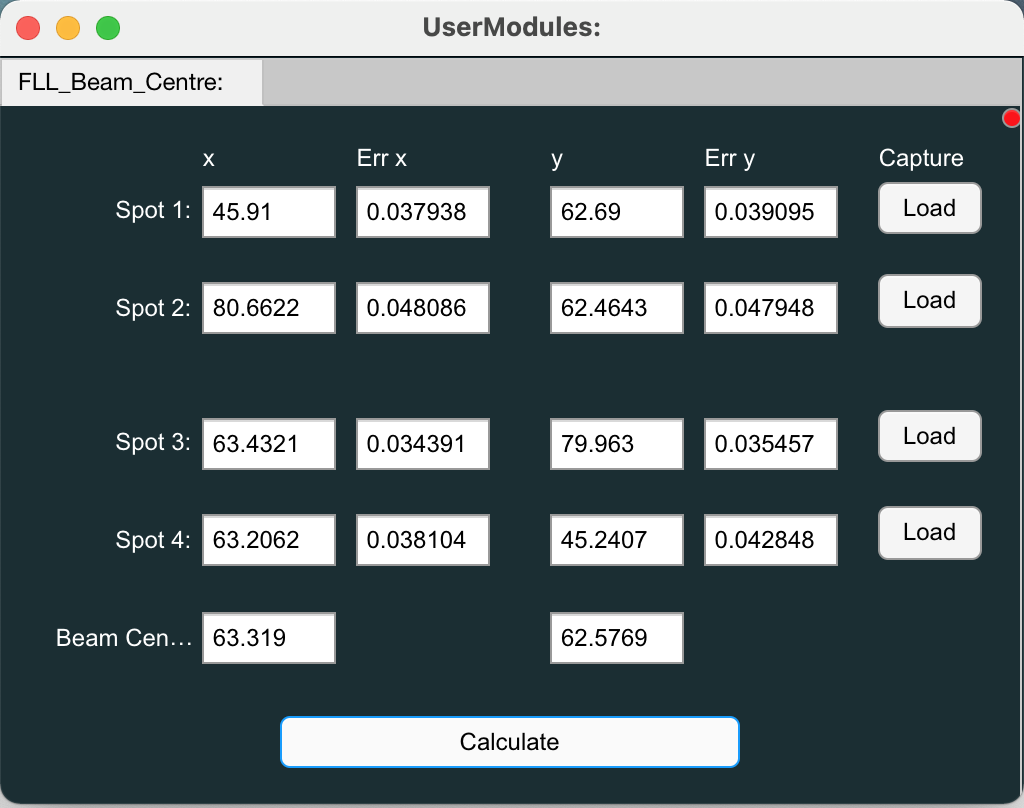
- Open the 'FLL Beam Centre Calculator' window from the 'User Modules > Vortex > FLL Beam Centre Calculator' menu.
- Use the 2D Curve Fitting module to fit 2 pairs (4 spots). As the Bragg peaks are fitted in turn, collect the spot co-ordinates in the beam centre calculator module.
- When you have fitted and collected the 2 pairs (4 spots) click 'Calculate' to calculate the new beam centre. This new value will be displayed in the user module window and also update the main beam centre value in the main display.
- From now on, with an accurate beam centre, radially symmetric analysis operations can be reliably be performed.
Let's do this again .....Rapidly!
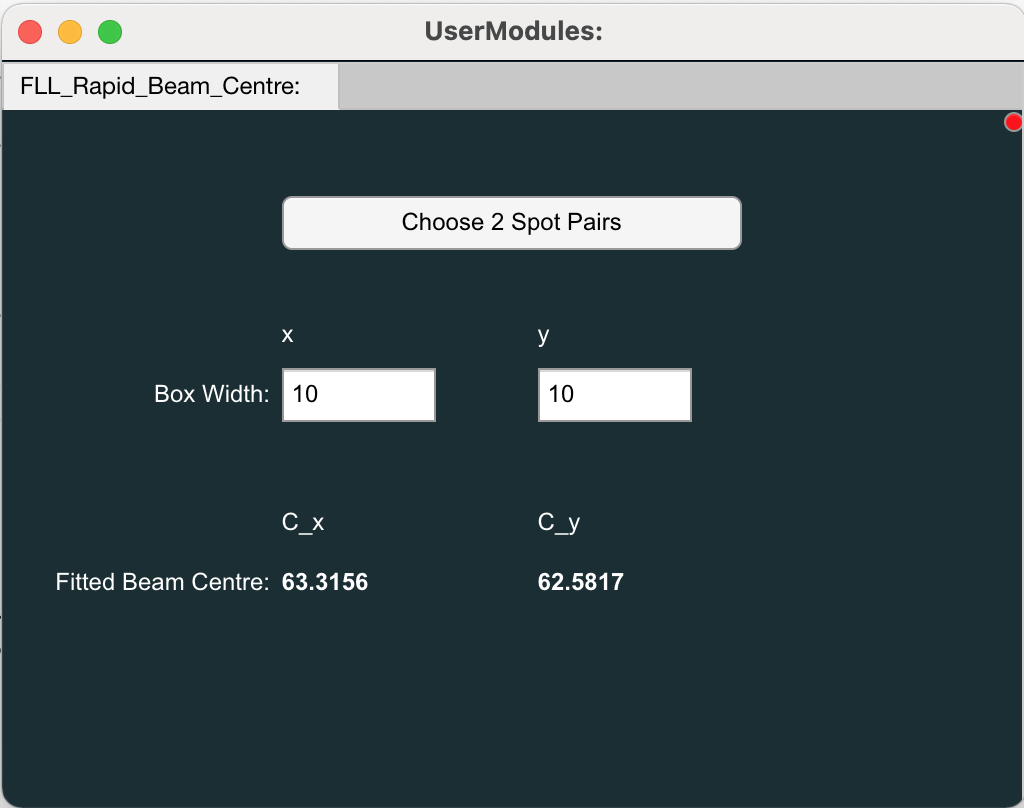
- Open the 'FLL Rapid Beam Centre Calculator' window from the 'User Modules > Vortex > FLL Rapid Beam Centre Calculator' menu.
- Click the 'Choose 2 Spot Pairs' button.
- This redirects you back to the main Grasp display.
- On a fully zoomed-out image of the data click on the 2 spot pairs in order (first pair then second pair).
- The FLL Rapid Beam Centre Calculator module will automatically open the 2D Curve Fit window, fit the 4 spots, calculate the new beam centre and place the new coordinates directly into the Beam Centre panel in the main Grasp window.
Acknowledgement
This data was taken as part of a collaboration with Don McK Paul. A publication describing the data can be found at: https://journals.aps.org/prb/abstract/10.1103/PhysRevB.72.014542
Last Modified 2 August 2024 by C. Dewhurst