The backscattering
monochromator is moved with a velocity vD parallel to the
reciprocal lattice vector τ . Thus the energy of the reflected neutrons
is modified via a longitudinal Doppler effect: ![]() (in first order and for vD << vi; the neutrons "see"
a different lattice constants in case of a moving lattice). One registers the
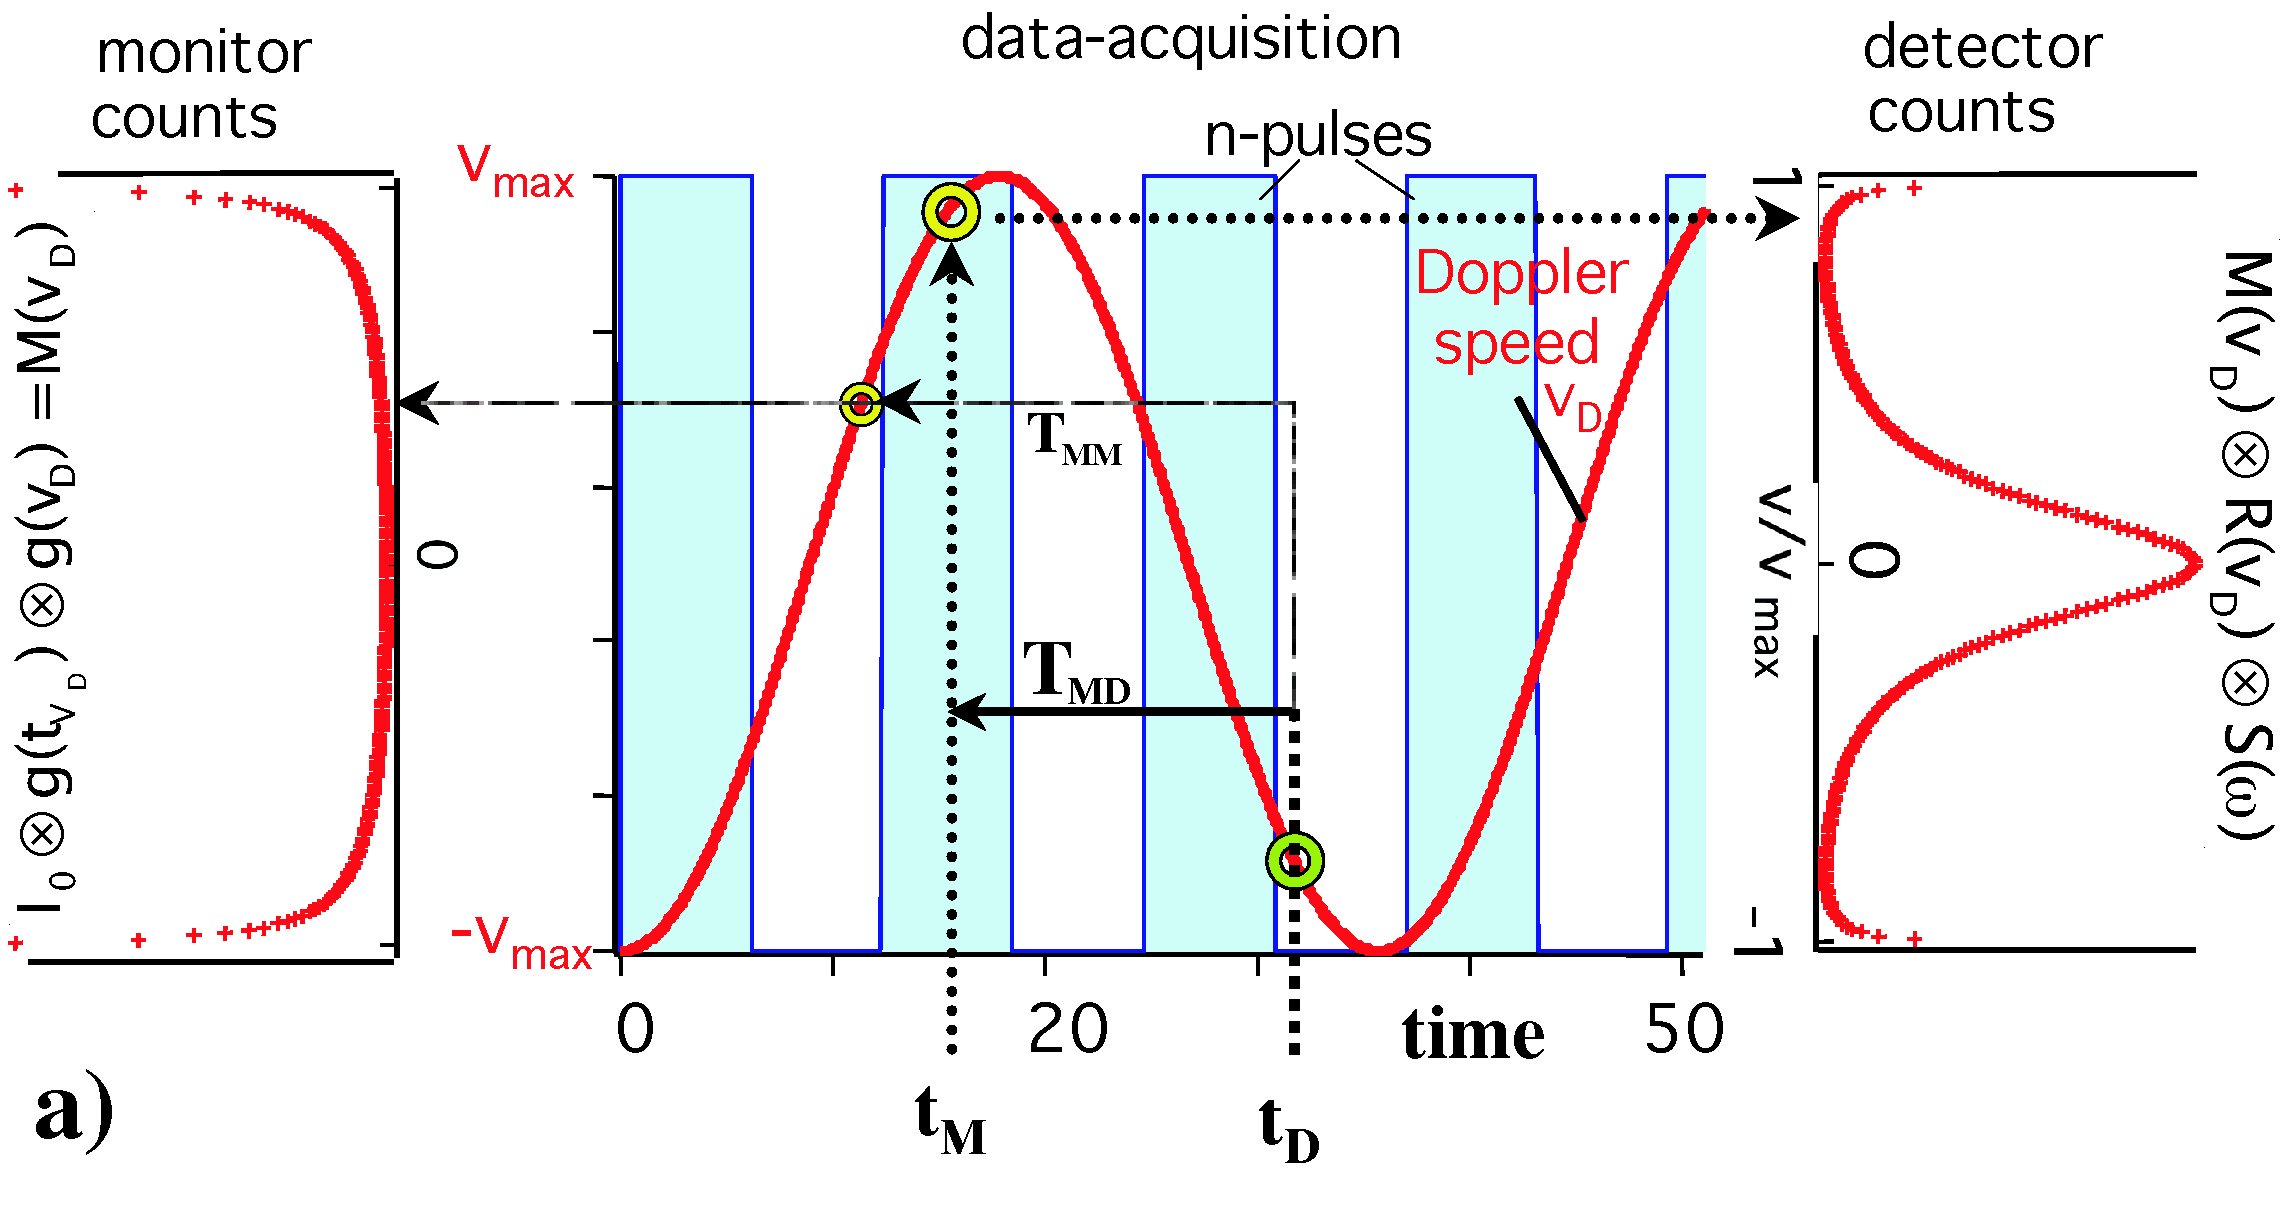
scattered neutrons as a function of the Doppler velocity vD. The
maximum achievable Doppler speed vD determines the maximum energy
transfer that can be reached. The Doppler velocity is varied periodically (sinusoidal
function in v(t) diagram of Fig.1) and for identical analyser- and monochromator-crystals
(same temperature and orientation) the corresponding energy transfer is centred
around E=0. If we count a neutron at time tD then we have to know
which speed v(tM) the monochromator had earlier at time tM
= tD.-TMD (TMD = neutron flight time from the
monochromator to the detector) when the neutron was at the monochromator. Neutrons
are then accumulated into the corresponding equidistant velocity channels v(tM)
(Fig.1; rhs for detector and lhs for monitor). The neutron flight times between
the monochromator and the detector or monitor, TMD and TMM,
are assumed to be constant, because kf is fixed and we neglect the variation of the
monochromator position and the small change of neutron speed (valid for IN10,
IN16 and BSS; HFBS and RSSM have 3 times larger monochromator amplitudes and
higher speed, thus T is no longer a constant). Data are acquired with constant
time bins of typically several 10 µs and thus, for a non-linear Doppler velocity,
a constant rate signal (e.g. background) shows up as the inverted function of
the periodic Doppler motion (see monitor spectrum in the left vertical graph
of Fig.5a). The monitor spectrum indicates how much time is spent measuring
each velocity channel, g(tC), multiplied by the distribution function
g(v0), the number of neutrons available in the primary beam around
velocity v0. The Doppler velocity profile is often sinusoid-like,
but in order to get a more equal measuring time distribution over the spectrum
one might try to build Doppler drives which approach a triangular velocity profile.
As for the sample scattering, elastically scattered neutrons will show up as
a peak in the middle of the spectrum, the width of which corresponds to the
instrumental resolution R(ω). The right hand side of Fig.1 shows that
a Lorentzian-like scattering law will be distorted due to the non-linear Doppler
motion and thus each spectrum has to be divided by the monitor spectrum (assuming
a low background). An offset of the measured energy transfer range from zero
can be achieved by choosing Doppler-monochromator-crystals with different d-spacing
(e.g. Si1-xGex ), orientation or temperature from that
of the analyser system (typically Si(111)).
(in first order and for vD << vi; the neutrons "see"
a different lattice constants in case of a moving lattice). One registers the
scattered neutrons as a function of the Doppler velocity vD. The
maximum achievable Doppler speed vD determines the maximum energy
transfer that can be reached. The Doppler velocity is varied periodically (sinusoidal
function in v(t) diagram of Fig.1) and for identical analyser- and monochromator-crystals
(same temperature and orientation) the corresponding energy transfer is centred
around E=0. If we count a neutron at time tD then we have to know
which speed v(tM) the monochromator had earlier at time tM
= tD.-TMD (TMD = neutron flight time from the
monochromator to the detector) when the neutron was at the monochromator. Neutrons
are then accumulated into the corresponding equidistant velocity channels v(tM)
(Fig.1; rhs for detector and lhs for monitor). The neutron flight times between
the monochromator and the detector or monitor, TMD and TMM,
are assumed to be constant, because kf is fixed and we neglect the variation of the
monochromator position and the small change of neutron speed (valid for IN10,
IN16 and BSS; HFBS and RSSM have 3 times larger monochromator amplitudes and
higher speed, thus T is no longer a constant). Data are acquired with constant
time bins of typically several 10 µs and thus, for a non-linear Doppler velocity,
a constant rate signal (e.g. background) shows up as the inverted function of
the periodic Doppler motion (see monitor spectrum in the left vertical graph
of Fig.5a). The monitor spectrum indicates how much time is spent measuring
each velocity channel, g(tC), multiplied by the distribution function
g(v0), the number of neutrons available in the primary beam around
velocity v0. The Doppler velocity profile is often sinusoid-like,
but in order to get a more equal measuring time distribution over the spectrum
one might try to build Doppler drives which approach a triangular velocity profile.
As for the sample scattering, elastically scattered neutrons will show up as
a peak in the middle of the spectrum, the width of which corresponds to the
instrumental resolution R(ω). The right hand side of Fig.1 shows that
a Lorentzian-like scattering law will be distorted due to the non-linear Doppler
motion and thus each spectrum has to be divided by the monitor spectrum (assuming
a low background). An offset of the measured energy transfer range from zero
can be achieved by choosing Doppler-monochromator-crystals with different d-spacing
(e.g. Si1-xGex ), orientation or temperature from that
of the analyser system (typically Si(111)).
October 20, 2005