
|
Origin, Current Status, Future Developments of Neutron Backscattering |
Never
put off till tomorrow what you can do the day after tomorrow.
(Mark Twain)
2.2 Backscattering from Perfect Crystals
2.3 Backscattering Geometry and Energy Variation
2.4 Principal Layout of Backscattering Diffractometers
3.1 Backscattering Spectrometers
4. Applications of Neutron Backscattering Spectroscopy
4.3 Critical Scattering near Phase Transitions
4.4 Dynamics of Spin Glasses and of the Glass Transition
4.5 Reorientational Motions in Molecular (Plastic) Crystals
4.6 Dynamics of Liquid Crystals and Molecular Liquids
4.8 Dynamics in Polymers and Biological Model Systems
4.9 Diffusion Mechanisms in Metals, Alloys, Intercalation Compounds and of Hydrogen in Metals
5.1 Precision Measurement of h/m
5.2 Backscattering and Polarisation
6. Future Prospects and Outlook
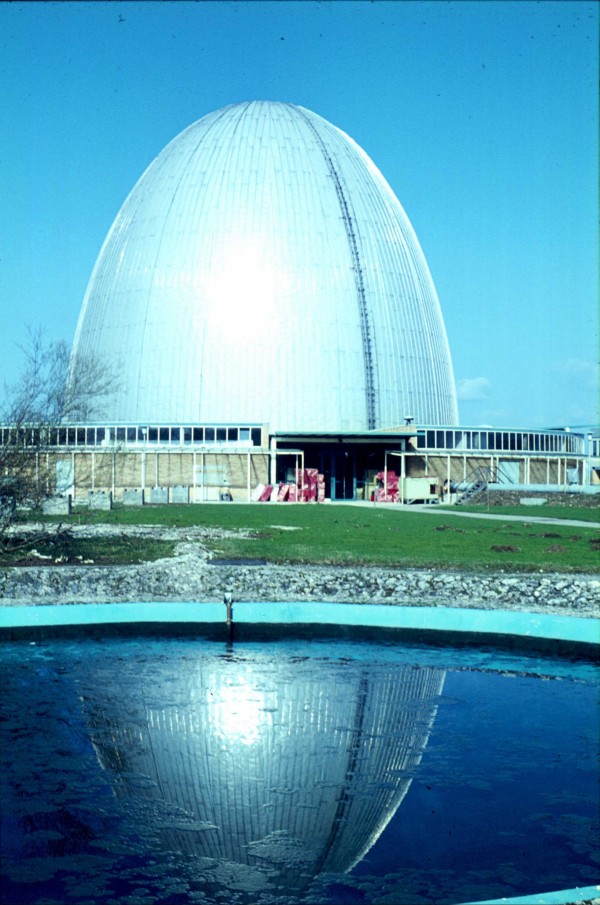
Neutron backscattering spectroscopy (BS) has been proposed by Maier-Leibnitz nearly 50 years ago. The basic idea is to use Bragg angles of near 90° with moderate collimation for beam monochromatisation and analysis in order to obtain very high energy resolution. The first BS experiments were carried out at the Munich research reactor FRM in 1969. This method improved the energy resolution of neutron spectrometers by about two orders of magnitude, pushing it into the µeV range. The prototype BS spectrometer built at the FRM yielded an energy resolution of 0.6 µeV (FWHM). For the first time the hyperfine splitting of the vanadium nucleus in magnetically ordered V2O3 could be measured with neutron scattering. Since these early experiments BS spectroscopy has substantially evolved. BS spectrometers have been developed and used in Jülich (Germany), at the ILL (France) and more recently at other neutron scattering centers at reactors and spallation sources.
In this review we shall explain the BS technique, describe BS instruments, give an overview of applications in the field of condensed matter research and more specialized fields and finally present an outlook into future developments in BS spectroscopy. Section 2 is devoted to some basic considerations about energy resolution and flux. In section 3 we present BS instruments including a short description of X-ray BS instruments. Some common applications of BS spectroscopy are outlined in section 4. Special applications and future developments are described in sections 5 and 6.
A short comparison
between neutron backscattering and neutron spin echo spectroscopy which both
are very high energy resolution techniques can be found in appendix A
The main idea of backscattering consists in using a Bragg angle close to 90° for the selection and for the analysis of the wavelength λ of neutrons or X rays in a spectrometer or diffractometer [2.1 - 2.6]. Under this condition the Bragg reflected wavelength band Δλ becomes very narrow. This can be seen easily by differentiating the Bragg equation
![]() (1)
(1)
 (2)
(2)
where d is the
lattice spacing and ΔΘ is the angular divergence of the beam.
![]() represents
the relative width of the wavelength band for an infinitely sharp collimated
beam.
represents
the relative width of the wavelength band for an infinitely sharp collimated
beam. ![]() is caused by lattice strains, primary and secondary extinction.
It follows from Eq. 2 that for θ = 90° the second term in Eq.
2 becomes zero, or in other words
is caused by lattice strains, primary and secondary extinction.
It follows from Eq. 2 that for θ = 90° the second term in Eq.
2 becomes zero, or in other words ![]() becomes, in first order, independent of the beam
divergence ΔΘ . In order to investigate the resolution in more
detail near θ = 90° it is convenient to look at the Bragg equation
in reciprocal space ( see Fig.1).
becomes, in first order, independent of the beam
divergence ΔΘ . In order to investigate the resolution in more
detail near θ = 90° it is convenient to look at the Bragg equation
in reciprocal space ( see Fig.1).

Fig. 1. Backscattering geometry in reciprocal space near θ = 90°.
 is a reciprocal
lattice vector and
is a reciprocal
lattice vector and 
Defining Δk as the difference between the longest and shortest k vector caused by a divergent beam and extinction we find:
 (3)
(3)
where ε =
90° - θ. For small values of  we can expand Eq. 3 to first order,
so that
we can expand Eq. 3 to first order,
so that
 (4)
(4)
For exact backscattering we obtain
 (5)
(5)
Therefore in this
special case the angular divergence contributes only in second order and we
can rewrite Eq. 2 for the case of near backscattering 
 (6)
(6)
2.2 Backscattering from perfect crystals
It has been shown by Darwin [2.7]
and Ewald [2.8] that even for perfect crystals the term
has a finite value due to primary extinction. They derived functions for the
reflectivity R of perfect crystals which may be represented by [2.9]
 (Ewald) (7)
 (Darwin) (8)
Both curves are
plotted in Fig.2. They have a central plateau Δy where the reflectivity
is 100 % and are slightly different for y >1 [2.63] . We will show now how
this plateau is related to ![]() .
.

The variable y is given by
 (9)
(9)
where for neutrons
 (10)
(10)
 (11)
(11)
 (12)
(12)
Fτ
is the structure factor associated with the reciprocal lattice vector
![]() Nc the number density of unit
cells, E the kinetic energy of the neutrons and
Nc the number density of unit
cells, E the kinetic energy of the neutrons and ![]() is the angle between the incident beam and the inward normal on the surface
of the crystal slab,
is the angle between the incident beam and the inward normal on the surface
of the crystal slab, ![]() is the angle between the reflected beam and the inward normal. V(τ) is
the Fourier transform of the crystal potential
is the angle between the reflected beam and the inward normal. V(τ) is
the Fourier transform of the crystal potential ![]() :
:
 (13)
(13)
It follows that V(0) is given by :
 (14)
(14)
where Nc is the number density of atoms. α and therefore y are, depending on how R is measured, linear functions of θ, λ or k :

where  (18)
(18)
Therefore we obtain for the width Δy of the plateau of the reflection
curves:

We note that only in the case in which one measures R as a function of k, the width of the reflection curve is independent of the Bragg angle ΘB and depends only on the crystal properties :
 (22)
(22)
One can call
![]() the "radial"
mosaic distribution caused by primary extinction in analogy to the angular
mosaic spread η in imperfect crystals. This is shown in Fig. 3 where
we depicted the influence of primary extinction on the Bragg reflection plotted
in reciprocal space.
the "radial"
mosaic distribution caused by primary extinction in analogy to the angular
mosaic spread η in imperfect crystals. This is shown in Fig. 3 where
we depicted the influence of primary extinction on the Bragg reflection plotted
in reciprocal space.

Fig. 3. Effect of primary extinction on the Bragg reflection shown in reciprocal space
The neutron energy width ΔEext resulting from the term ![]() only neglecting correction factors ( FWHM or convolution factors: For more
details click here.) is given by:
only neglecting correction factors ( FWHM or convolution factors: For more
details click here.) is given by:
 (23)
(23)
Thus ΔEext
is independent of τ and depends only on the structure factor Fτ
and on Nc. Table 1 shows values of ![]() and ΔEext for a few crystal planes. Obviously the values of
ΔEext are in the range below 1µeV and therefore one
can neglect the influence of
and ΔEext for a few crystal planes. Obviously the values of
ΔEext are in the range below 1µeV and therefore one
can neglect the influence of ![]() and ΔEext on the energy resolution of conventional crystal
spectrometers using Bragg angles far away from 90° where the resolution
is dominated by the geometry term ctg ΘΔΘ.
and ΔEext on the energy resolution of conventional crystal
spectrometers using Bragg angles far away from 90° where the resolution
is dominated by the geometry term ctg ΘΔΘ.
|
Crystal plane |
|
ΔEext (μeV) |
λ (Å) |
|
Si (111) |
1.86.10-5 |
0.077 |
6.2708 |
|
Si (311) |
0.51.10-5 |
0.077 |
3.2748 |
|
Ca F2 (111) |
1.52.10-5 |
0.063 |
6.307 |
|
Ca F2 (422) |
0.54.10-5 |
0.177 |
2.23 |
|
Ga As (400) |
0.75.10-5 |
0.153 |
2.8269 |
|
Ga As (200) |
0.157.10-5 |
0.008 |
5.6537 |
|
Graphite (002) |
12.10.10-5 |
0.44 |
6.70 |
For Bragg angles
near 90° however we cannot neglect ![]() .
.
We now consider the special case of a perfect crystal in exact backscattering
at the end of a neutron guide. The theoretical beam divergence at the end
of the guide is  (24)
(24)
Therefore from
Eqs. 5 and 23
 (25)
(25)
The index g stands for neutron guide. In this special case the energy width DE is independent of the energy and depends only on the neutron guide material and on the crystal quantities. Using as an example the values for a nickel coated neutron guide and a perfect silicon crystal with the (111) planes in backscattering we get
ΔE= (0.24 + 0.08) µeV
In this case the beam divergence contributes to ΔE three times more than primary extinction.
In an optimized case one would match the contributions to ΔE from the divergence and from primary extinction i.e. (see Eq. 5)
 (26)
(26)
or
 (27)
(27)
From Eq. 27
we can calculate the optimum beam divergence in the case of exact backscattering
as a function of the primary extinction ![]() .
Fig. 4 represents Eq. 27 in reciprocal space and shows the dependence
of
.
Fig. 4 represents Eq. 27 in reciprocal space and shows the dependence
of ![]() on
on ![]() .
.

Fig. 4
Finally let us calculate the flux of backscattered neutrons we would obtain
for the case of a perfect silicon (111) crystal at the end of a nickel coated
straight neutron guide assuming no losses.
One can show that the intensity of a neutron beam produced by a reactor
with a moderator in thermal equilibrium is given by [2.10]  (28)
(28)
where Φ is the total thermal flux of the reactor and kT
is the "thermal" wave vector:
 (29)
(29)
where T is the temperature of the moderator. We calculate I for two
special cases :
1. For the first Munich research reactor FRM without a cold source we have:
![]()
![]()
![]()
2. For the high flux reactor HFR of the ILL with a cold source we have:
![]()
![]()
![]()
From these
flux estimations it is obvious that it is extremely difficult to perform
backscattering spectroscopy at the FRM because of the low flux. However
at the HFR inelastic high resolution experiments are certainly feasible.
For the sake of completeness we mention that backscattering from imperfect
crystals has been considered by Hiismäki [2.11].
2.3. Backscattering Geometry and Energy Variation
The Bragg equation shows that the reflected wavelength can be varied either by a change of the Bragg angle Θ or by a change of the lattice spacing d. Obviously only the second method can be used in the backscattering case. The lattice spacing of a given crystal can be varied in several ways which will be explained in the following.
2.3.1. Doppler Effect
Neutron reflection from moving lattices has been treated in the past in several papers [2.12-2.16]. The energy and wavevector conservation laws allow us to calculate the relevant effects :
![]() (30)
(30)
 (31)
(31)
where
Ef and ![]() (Ei and
(Ei and ![]() ) are the final (initial) neutron energy
and velocity,
) are the final (initial) neutron energy
and velocity, ![]() is the Doppler velocity. For the special
case of backscattering from a crystal moving parallel or antiparallel to
the neutron beam direction, i.e.
is the Doppler velocity. For the special
case of backscattering from a crystal moving parallel or antiparallel to
the neutron beam direction, i.e.![]() parallel to
parallel to ![]() we get in first order (VD <<
V)
we get in first order (VD <<
V)
 (32)
(32)
The energy change δE of backscattered neutrons is therefore in first order linear in the Doppler velocity. Doppler velocities of about 2.3 m/s, corresponding to energy changes of ±15 µeV for 6.3 Å neutrons were obtained easily on spectrometers like IN10. Today about 5 m/s are reached with mechanical and linear motor drives.
A chapter dedicated to the evolution of velocity drives in BS spectroscopy can be opened here.
Lattice parameter variation by temperature changes is another means to vary the reflected neutron energy :
 (33)
(33)
with d(T) = do (1 + ßo T + ß1 T2 + ...) (34)
Table
6 shows relative energy variations  for several crystals for a temperature variation between 80K and 700K. Energy
variations up to a few percent are possible for crystals with high thermal
expansion.
for several crystals for a temperature variation between 80K and 700K. Energy
variations up to a few percent are possible for crystals with high thermal
expansion.
|
Monochromator |
Structure |
ao(Å) |
Lattice plane (hkl) |
Tm(K) |
(meV) |
(meV) |
(meV) |
|
% |
|
KCl |
NaCl |
6.29294 |
200 |
1040 |
-15 |
80 |
0.113 |
2.71x10⁻⁵ |
4.60 |
|
CaF2 |
CaF2 |
5.462 |
111 |
1696 |
0 |
70 |
0.063 |
1.52x10⁻⁵ |
3.36 |
|
BaF2 |
CaF2 |
6.196 |
200 |
1628 |
-65 |
- 10 |
0.051 |
1.19x10⁻⁵ |
2.58 |
|
AgCl |
NaCl |
5.547 |
111 |
728 |
60 |
140 |
0.047 |
1.16x10⁻⁵ |
4.01 |
|
NaI |
NaCl |
6.4728 |
200 |
934 |
100 |
190 |
0.067 |
1.71x10⁻⁵ |
4.61 |
|
NaCl |
NaCl |
5.62799 |
111 |
1074 |
120 |
210 |
0.074 |
1.92x10⁻⁵ |
5.03 |
|
NaBr |
NaCl |
5.97324 |
200 |
1020 |
- 240 |
-140 |
0.100 |
2.18x10⁻⁵ |
4.36 |
|
AgBr |
NaCl |
5.7745 |
200 |
705 |
-400 |
-280 |
0.145 |
2.82x10⁻⁵ |
4.89 |
|
NaCl |
NaCl |
5.62799 |
200 |
1074 |
-530 |
-400 |
0.157 |
3.03x10⁻⁵ |
5.03 |
|
TIBr |
CsCl |
3.97 |
110 |
753 |
-545 |
-400 |
0.130 |
2.5x10⁻⁵ |
5.59 |
|
AgCl |
NaCl |
5.547 |
200 |
728 |
-610 |
-520 |
0.195 |
3.67x10⁻⁵ |
3.38 |
|
CaF2 |
CaF2 |
5.462 |
200 |
1696 |
-690 |
-600 |
0.078 |
1.42x10⁻⁵ |
3.36 |
|
TICl |
CsCl |
3.834 |
110 |
703 |
-730 |
-620 |
0.173 |
3.12x10⁻⁵ |
3.95 |
|
NaCl |
4.62 |
111 |
1266 |
-815 |
-700 |
0.042 |
0.73x10⁻⁵ |
4.00 |
|
|
RbI |
NaCl |
7.342 |
220 |
9 20 |
-1050 |
-850 |
0.056 |
0.93x10⁻⁵ |
6.59 |
|
Si |
Diamond |
5.4306 |
111 |
1683 |
- 2 |
4 |
0.077 |
1.86x10⁻⁵ |
0.29 |
Table
6. Possible monochromators for cold neutron BS spectrometers.
Tm is the melting point, ![]() and
and ![]() the minimum and maximum energy transfer using a silicon (111)
analyser at room temperature and a temperature scan from 80K to 700K for
the monochromator. is the corresponding
relative energy change of neutrons. One of the best examples of the use
of this technique on IN10 can be found by clicking here. A chapter dedicated to monochromator temperature
scan devices can be opened by clicking here.
the minimum and maximum energy transfer using a silicon (111)
analyser at room temperature and a temperature scan from 80K to 700K for
the monochromator. is the corresponding
relative energy change of neutrons. One of the best examples of the use
of this technique on IN10 can be found by clicking here. A chapter dedicated to monochromator temperature
scan devices can be opened by clicking here.
2.4. Principal Layout of Backscattering Diffractometers
It
was recognized early on [2.17] that backscattering can be used for high
accuracy lattice parameter measurements. The principle is explained in Fig. 5.

Fig. 5
A
white neutron beam penetrates the sample crystal which is adjusted with
the lattice planes perpendicular to the beam. For the wavelength λ
= 2d an intensity dip in the white spectrum is generated. For perfect crystals
the width of the dip is given by ![]() (see Eq. 22).
The spectrum is analyzed by a reference crystal, again in back reflection.
The reference crystal is moved back and forth by a velocity drive. If the
backscattered intensity is plotted against the Doppler velocity, the intensity
dip is observed for
(see Eq. 22).
The spectrum is analyzed by a reference crystal, again in back reflection.
The reference crystal is moved back and forth by a velocity drive. If the
backscattered intensity is plotted against the Doppler velocity, the intensity
dip is observed for
 (35)
(35)
where dd
is the difference between the lattice parameters of the sample crystal and
the reference crystal, ![]() the Doppler velocity for the intensity dip, b
is the adjustment error of nonparallelity between the two crystals. The
precision of this method is determined by the quality of the crystals and
the accuracy of the adjustment.
the Doppler velocity for the intensity dip, b
is the adjustment error of nonparallelity between the two crystals. The
precision of this method is determined by the quality of the crystals and
the accuracy of the adjustment.
2.5. Principal Layout of Backscattering Spectrometers
Two different principal layouts of backscattering spectrometers to measure quasielastic or inelastic neutron scattering can be distinguished. In the first type backscattering from crystals is used in both the primary (monochromator) and secondary (analyser) spectrometer. We call these instruments X-X-type backscattering spectrometers. In the second type, backscattering is used only for the analyser and the monochromatisation is determined by time of flight (TOF). We call these instruments TOF-X-spectrometers.
2.5.1. X-X-Backscattering Spectrometers
The
principal layout of this instrument which was proposed originally by Maier-Leibnitz
is shown in Fig. 6.

Fig. 6. Principal layout of a X-X-backscattering spectrometer.
The spectrometer is similar to a three axis spectrometer with Bragg angles
equal or near to 90°. The energy scan is performed by varying the incident
energy via the lattice spacing of the monochromator as described above.
The chopper is needed to discriminate between neutrons scattered by the
sample directly into the detectors and those backscattered from the analyser.
The chopper can be avoided only if one uses for the analyser a Bragg angle θ
significantly smaller than 90°, i.e. 90° - Θ >> ΔΘ
.
2.5.2. TOF-X-Backscattering Spectrometers
The
principal layout of this instrument is sketched in Fig. 7.

Fig. 7
Principal layout of a TOF-X-backscattering spectrometer.
A pulsed, white neutron beam travels down a very long neutron guide and
hits the sample. The scattered neutrons are analyzed for energy (as a function
of time of flight) and momentum change by a backscattering analyser crystals.
The backscattered neutrons are detected with detectors near to the sample.
2.6. Resolution Considerations
A backscattering spectrometer is in principle a very special three axis spectrometer. Therefore one could think that energy resolution calculations which have been published for three axis spectrometers [2.18, 2.19] should also be valid in backscattering spectrometers. This is however in general not the case for several reasons :
1.
The calculations are done for mosaic crystals and not for perfect crystals:
The term is neglected.
2.
The calculations are valid only for the non backscattering case  and not applicable for exact backscattering.
However
Pynn [2.20] has calculated the resolution function of a perfect-crystal
three axis X-ray spectrometer. Popovici [2.21] and later Grimm [2.22] have
included the term ![]() in extended Cooper-Nathans
calculations for three axis spectrometers with imperfect crystals. The backscattering
case
in extended Cooper-Nathans
calculations for three axis spectrometers with imperfect crystals. The backscattering
case  has only be treated by Birr et al. [2.4] in a simplified way
yielding expressions for the energy resolution as given by Eqs. 6 and 22.
This approach is however justified by the following facts valid for backscattering
spectrometers.
has only be treated by Birr et al. [2.4] in a simplified way
yielding expressions for the energy resolution as given by Eqs. 6 and 22.
This approach is however justified by the following facts valid for backscattering
spectrometers.
1. The variation of the incident energy is performed either by the Doppler effect or by lattice expansion of the monochromator crystal. This means that the geometry of the instrument remains unchanged during a measurement and therefore that the energy resolution is independent of the energy transfer.
2. Perfect crystal backscattering analyzers are normally spherically curved (see section 3.1) and geometrically arranged such that the center of the analyser sphere coincides with the sample and detector position. In this manner horizontal and vertical spatial focusing and energy focusing are achieved simultaneously. Therefore on the analyser side it is sufficient to calculate the energy resolution for one small perfect crystal, i.e. again using Eqs. 6 and 22 with ΔΘ properly calculated from the effects of crystal and sample size.
A special feature of backscattering is the fact that the horizontal and vertical collimation have the same influence on the energy resolution in contrast to three axis spectrometers. Therefore ΔΘ in Eq. 6 consists of two contributions: ΔΘ horizontal and ΔΘvertical, which have to be added together either linearly or quadratically for Lorentzian or Gaussian shaped resolution curves. For example :
 (36)
(36)
instead of Eq. 6
Monte
Carlo methods can be used with advantage to simulate the performance of
neutron spectrometers. This had been done by Kraxenberger for the backscattering
spectrometer IN13 [2.23] 25 years ago. He calculated the distribution of
incident and scattered neutrons in momentum space. Neutron beam defining
elements like the neutron guide, the monochromator and analyser crystals
(with specified values of ![]() and mosaic spread h
), the deflector and entrance and exist slits were simulated by program
subroutines. A close agreement was found between the calculations and the
resolution measurements.
and mosaic spread h
), the deflector and entrance and exist slits were simulated by program
subroutines. A close agreement was found between the calculations and the
resolution measurements.
Various program packages for instrument simulations based on the Monte Carlo technique have been developed in recent years. We mention only two of them:
VITESS has been initiated by a group at HMI, McStas by a group at Risø. These programs have been used to simulate backscattering instruments which were developed in recent years and on older instruments to check if these instruments could be improved. More information can be found below were the instruments are described.
3.1. X-X Backscattering Spectrometers
In
the following we will describe neutron X-X backscattering spectrometers
including an X-ray spectrometer which had been constructed in the past or
which are today operational or under construction. Fig. 8 shows a comparison
of four different layouts used on these instruments.

Fig. 8. Four different possibilities of X-X-backscattering spectrometers for neutrons.
The first of these has already been mentioned in section 2.5.1. Its drawback resides in the fact that the sample and detector are both very close to the white primary neutron beam.
The second version avoids this problem by using a so-called deflector crystal which allows the separation of the highly monochromatic beam from the white beam. Its drawback is that it - as the first version - requires an end position and its primary energy resolution is dependent on the beam divergency offered by the neutron guide.
The third version which uses two deflector crystals, avoids the above mentioned problems :
1. No transparent monochromator is needed.
2. The energy resolution of the primary spectrometer is independent of the neutron guide divergence but depends on the divergence defined by the size of the beam at the second deflector and the distance between the latter and the backscattering monochromator which is spherically curved.
Its drawback is its higher complexity and additional loss of intensity.
The
fourth version represents a backscattering option on a standard three axis
spectrometer. The three axis monochromator and analyser are replaced each
by a pair of crystals, one being the backscattering crystal, the other the
deflector crystal. In this way µeV resolution is achieved on
a three axis spectrometer (TAS) whilst maintaining the advantage of flexibility
and the good Q-resolution of a TAS instrument. The disadvantages of this
version compared to a normal TAS spectrometer are the low intensity (due
to the high energy resolution) and the limited energy scan range.
3.1.1
Matching of the Q-Resolution on X-X BS Spectrometers by phase space transformation
A characteristic property of the backscattering spectrometers is the relatively poor Q-resolution which results from the necessity of using large solid angle analyzers in the secondary part of the instrument to obtain more intensity. However on the primary side of the instrument, there is considerably less solid angle subtended due to the small divergence of the neutron beam coming from a neutron guide. In principle a gain of two orders of magnitude could be obtained by matching the incident beam divergence to that in the secondary spectrometer. The new spectrometers IN16 and BSS1 are equipped with supermirror compressors with an increase of the primary solid angle by a factor of about four. A further increase using this technique is difficult. In the following a method invented by Schelten and Alefeld [6.4] is described which increases the primary solid angle at least in one direction, leading to an intensity gain of about 5. The principle, often called Phase Space Transformation (PST), is shown in Figs. 42 and 43. A computer simulation of this phase space transformation can be seen by clicking here.
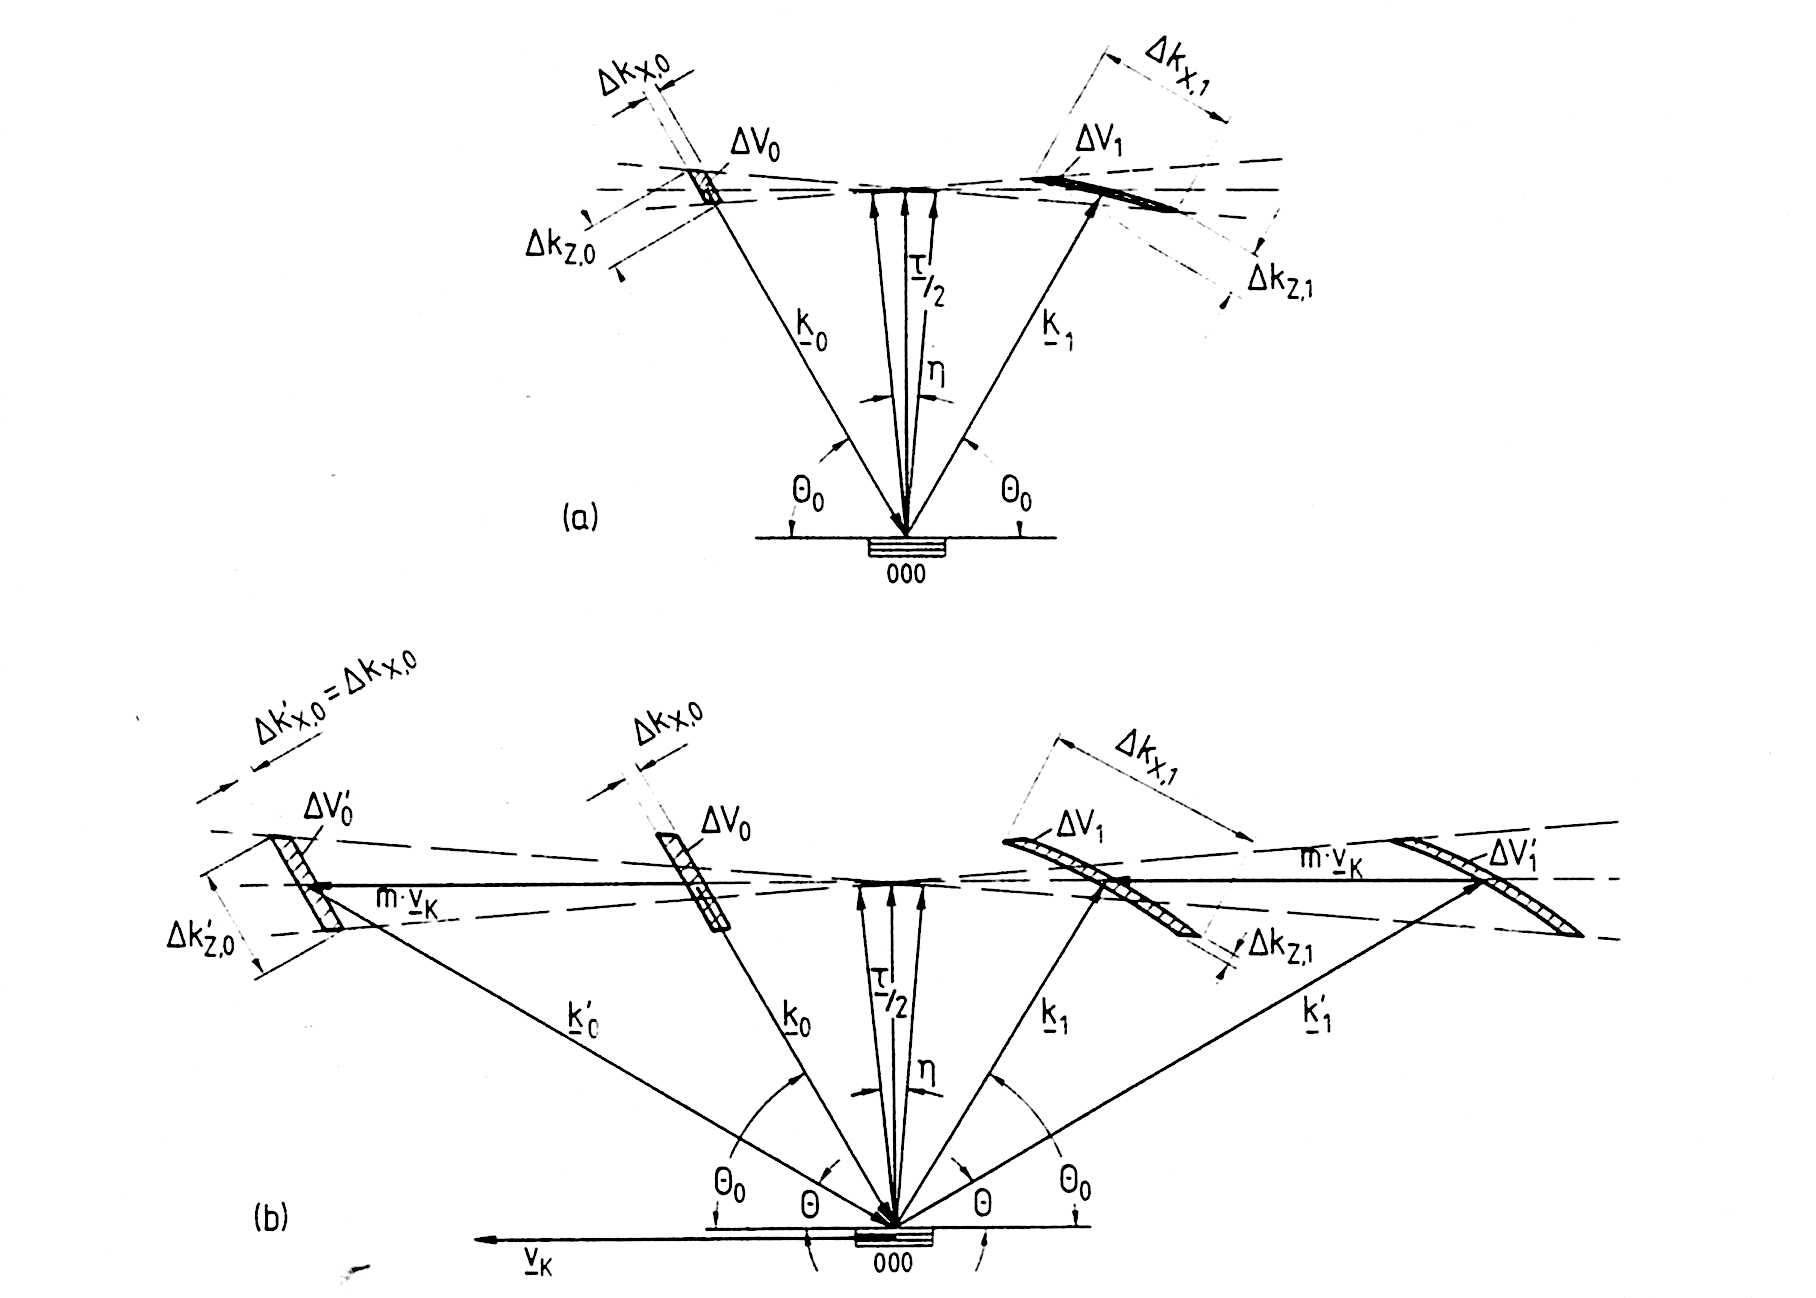
Fig. 42. Bragg reflection of neutrons from a mosaic crystal moving with a velocity Vk perpendicular to the reciprocal lattice vector.

Fig. 43. Sketch of a BS spectrometer with a matched Q resolution.
The neutrons are reflected by a mosaic crystal which moves with a velocity
Vk parallel to the reflecting lattice planes. In this way a cigar
shaped momentum space element of small divergence δk and large k-vector
distribution Δk is transformed into a concavely curved one with divergence
Δk' and k-distrbution δk'. Such a phase space transformation can
be characterized by the term 'from white' to 'wide'. This divergent
beam then impinges under backreflection upon silicon monochromator crystals
arranged on a spherical surface. The backscattered neutrons are focused
on to the sample. In terms of intensity a gain of the order of Δk'/δk
is achieved.
The phase space transformation can best be illustrated by a diagram (see Fig. 42). The slope of the momentum element after diffraction is given by
 (49)
(49)
in which Θ0 is the Bragg angle in the laboratory system and θ that in the crystal system which is determined by the crystal velocity.
![]() (50)
(50)
χ can be chosen such that the momentum space element after deflection
is perpendicular to wave vector k', which means that:  .
.
Then from Eq. 50 it follows that
tgΘ = - ctg(2Θ0) (51)
and
from (50) and (51) the appropriate crystal velocity can be calculated, which
for a moving graphite(002) deflector combined with a Si(111) backscattering
crystal is of the order of 300 m/s. 3.1.2.
A bit of history: The first "Rückstreuspektrometer" at the FRM in Munich The
first backscattering spectrometer was built in Munich and became operational
in 1969. [2.4]. Fig.
9. Schematic drawing of the 'Rückstreuspektrometer' at the FRM in Munich. The
silicon monochromator was placed into the white beam coming from a glass
neutron guide. For scanning the neutron energy the monochromator was mounted
on a velocity drive . Already this instrument was operated with a conical
nickel coated beam concentrator which enhanced the solid angle of the glass
guide such that it 'fitted' a nickel coated guide. An increase of the flux
by a factor 1.9 was thereby achieved. For the analyser, about 1900 silicon
single crystal slices were cut with an accuracy of 0.1 degree parallel to
the (111) planes, and glued on concave spherically curved aluminum shells.
The Si crystals focused the scattered intensity into the detector. The energy
resolution was 0.6 µeV (FWHM). Apart from severe intensity problems
due to the small reactor flux and the lack of a cold source the performance
of this spectrometer was very limited: 1.
Measurements could be performed only by integrating over a large Q-range
with an average Q-value of 1.4 Å-1. 2.
The energy range was limited to ± 4 µeV.
3.1.3
More history: The π-Spectrometer at the FRJ-2 in Jülich After
the first backscattering experiments in Munich it became clear that a reactor
with higher flux and with a cold source was required for this kind of spectroscopy.
Consequently, in 1969 construction of a new spectrometer was started at
the FRJ-2 in Jülich with a 200 times higher cold neutron flux
[2.5]. As shown in Fig. 10, Fig.
10. Schematic drawing of the π-spectrometer at the FRJ-2 in Jülich. 3.1.4.
The BS Spectrometer IN10 at the HFR Grenoble This
instrument, shown in Fig 11 Fig.
11 the BS spectrometer IN10
is situated at the end of the curved nickel coated neutron guide H15 which
views the vertical cold source of the ILL [2.24]. The cold neutron beam
has a total flux of about 2.109 neutrons/cm2s with a
spectral distribution around 6 Å. The width of the neutron guide
is 3 cm, the height 20 cm. Only the upper 5 cm of the beam
is used for IN10. The beam travels along a straight neutron guide section
with 3 x 5 cm2 cross-section and 10 meters length. It is followed
by a further section with the same width, but 8 cm high and 6.3 meters
long. The neutrons are backscattered from the monochromator which is mounted
on the piston of a crank shaft velocity drive. The Bragg angle is 89.8°. About
40% of the backscattered monochromatic beam is deflected off a (002) oriented
graphite crystal (situated just above the incoming primary beam) into a
third neutron guide (branching-off tube) of 3 x 3 cm2
and 4.25 m length. This guide has a supermirror coating in order to
reduce transmission losses due to the increased divergency of the beam after
the deflector. The deflector has an anisotropic mosaic distribution, i.e.
ηvertical = 0.4°, ηhorizontal = 1.2°. The
neutrons then pass a chopper and a monitor, enter the analyser container
and hit the sample. The scattered neutrons are analyzed for momentum and
energy changes by analyser crystals. The analysers consist of single crystal
wafers that are glued in the (111) or (311) orientation to the surface of
spherically curved aluminum plates. These spherical segments have a radius
of curvature of 1.5 m and are aligned so that neutrons backreflected
from each one are focussed onto a 3He-detector located near the
sample. Initially the analyser spheres where covered by small hexagonal
single crystals of 1 cm diameter and 0.7 mm thickness (see Figures below).
All analysers of IN10 were a few years ago changed by adopting a new technique
to deform large Si-crystals which had been developed on IN16 (images of different analysers / monochromators
can be found here). Today the analysers consist of hexagonal silicon
single crystal slices of 0.5 mm thickness and a diameter of 6 cm. Spectra
with up to 8 different momentum transfers can be measured simultaneously.
An additional set of seven circular analyzers centered around the forward
transmitted beam covers the small angle region (0.07 < Q < 0.3 Å-1).
The chopper has a duty cycle of 50% and provides the trigger signal for
the electronic gate. Neutrons, scattered into the detector directly from
the sample, are not counted. The
graphite crystal, the branching-off-guide and the analyser container with
the chopper can be rotated around a vertical axis, defined by the crossover
of the mid line of the main guide and the branching-off-guide, when the
wavelength is changed. The
Doppler velocity of the monochromator is measured with an induction coil
and a magnetic core, which is rigidly connected to the monochromator. It
provides a voltage signal directly proportional to the velocity of the monochromator.
The output voltage is amplified and digitalised. Together with the detector
code it defines the channel number of the core storage into which the neutrons
are sorted. (more information on data acquisition here)
The
analyser container can be filled with Argon gas to reduce neutron losses
and the background. For
further details see IN10. The instrument was commissioned
in 1974. Subsequently, it became very popular and could until recently be
considered as the first work horse in neutron backscattering spectroscopy.
The majority of publications until about 1995 (see references to chapter
4) is based on experiments performed on this machine. Click
on 2004-1993 or 1993-1984
or 1984-1974 to access a more or less complete
list of publications of experiments carried out on IN10. IN10
Analyser Plates 3.1.5
The BS Spectrometer IN13
at the HFR Grenoble Cold
neutron backscattering has one drawback: the limitation in momentum transfer:
Q < 2Å-1 for 6 Å neutrons. Therefore the IN10 spectrometer
has an additional set of Si(311) monochromator and analyzers crystals which
permit to access Q values up to 3.8 Å-1. This setup has been used with success to measure the
elastic incoherent structure factor of adamantane [4.47]. The problem with
this setup is however the low intensity. Therefore a dedicated backscattering
spectrometer for thermal neutrons, IN13, was developed at the ILL
and commissioned in 1980 [2.24]. IN13
is installed at the thermal neutron guide H24 of the ILL with a total flux
of 5.108 neutrons/cm2s (see Fig. 12). Fig.
12. Schematic drawing of the backscattering spectrometer IN13 for thermal
neutrons at the HFR of the ILL in Grenoble.
CaF2 crystals with (422) orientation are used for the monochromator
and analyzers yielding a final energy of 16.45 meV (λ = 2.23
Å) in backscattering. The incident energy is scanned via thermal
expansion of the monochromator crystals (13.5 cm high, 5 cm wide
and 1 cm thick) which are mounted in a cryofurnace
operating with liquid N2 as coolant. The
temperature of the monochromator can be scanned from 80 K to 720 K
continuously with a stability of 0.5 K yielding an energy transfer
range from -125 µeV to 300 µeV. The analyser crystals
are held at room temperature. The monochromator Bragg angle can be varied
between 89° and 81° with a corresponding energy resolution of the
spectrometer between 8 µeV and 24 µeV (FWHM). A vertically curved
composite graphite crystal (9 lamella of 5 x 1.5 x 0.4 cm3, mosaic spread 0.4°) focuses the beam onto
the sample. The scattered neutrons are analyzed for energy and momentum
transfer by a set of seven spherically curved composite crystal analyzers (60 cm
high, 30 cm wide, radius of curvature 1 meter) with individual flat crystals of CaF2 of 2 x 2 x 0.15 cm3. An
additional set of three circular analyzers centered around the forward transmitted
beam covers the small angle region (0.15 < Q < 0.5 Å-1).
A disk chopper with 4 windows and a duty cycle of 33% between the deflector
and the sample is used to suppress the background of directly scattered
neutrons and higher order contaminations. The neutrons are counted with
a cylindrically shaped polydetector consisting of 32 vertical 3He
detectors in two staggered rows and three end window individual 3He
counters for the small angle analyzers. Click
on 2004-1989 and 1989-1982
to detect a complete list of publications of experiments performed with
IN13. Recent
progress on the improvement of IN13 has been publishes in a paper of Natali
et al 3.1.6
The BS Spectrometer BSS
at the FRJ-2 Jülich The
backscattering instrument BSS was built in the new guide hall ELLA at the
Jülich research reactor [2.6]. The instrument is very similar to IN10.
Although installed at a medium flux reactor with about 1014 neutrons/cm2s, BSS has a flux which is not much smaller than that
of IN10. This improvement was achieved by the efficient use of the rather
large area beam (7 x 10 cm2) from a Ni58
coated neutron guide. This large beam is focused to 3 x 3 cm2
by a vertically curved graphite deflector with an anisotropic mosaic spread
in conjunction with a converging supermirror guide. The anisotropic mosaic
spread (ηv = 0.4°, ηh = 1.2°) is obtained by mounting 3 graphite crystals
behind each other with orientations differing in the horizontal plane by
ηv. Another specialty of BSS1 is a hydraulic velocity drive
which allows energy scans with velocity profiles at the choice of the experimentalist.
A drawback of BSS is the use of a monochromator Bragg angle smaller than
90° in a beam from a Ni58 coated
guide, yielding an energy resolution of not better than 1.0 µeV (FWHM). 3.1.7
The BS Spectrometer IN16
at the HFR Grenoble The
layout of this instrument is shown in Fig. 13 Fig.
13: schematic view of the backscattering spectrometer IN16 [2.24].
The first vertically focusing triple graphite deflector, assembled by 9
triple graphite lamella according the same principle as the BSS deflector,
together with a conical supermirror guide focuses the 120 mm high and
60 mm wide beam of the neutron guide H53 onto a 27 x 27 mm²
spot at the focusing guide exit. Higher order contamination is eliminated
by a liquid N2 cooled beryllium filter. A background chopper
avoids that high intensity neutron pulses enter the spectrometer with the
graphite chopper in open position.
At a distance of 200 mm from the focusing guide exit the beam hits a graphite
deflector chopper with 90° sectors of alternating open or reflecting
segments (radius 294±30 mm; rotating with 2430 rpm; crystal speed
of about 74.8 ±7.6 m/s). The reflecting segments are built up by
trapezoidal shaped single cassettes hosting three horizontally inclined
PG(0 0 2) crystals of roughly 80′ mosaicity each, making up a total
horizontal mosaicity of about 240′ for deflecting the beam from the
focusing guide towards the backscattering monochromator. This graphite chopper
sends periodically, with a duty cycle of 50%, the coarsely monochromatic
neutrons to a spherically curved monochromator (Radius R = 2.1 m at a distance
of 1.9 meters) in nearly exact backscattering (focus at the guide exit).
In the secondary spectrometer, like on IN13, the analyzers cover the full
angular range and the neutrons are counted with a polydetector. The distance
between the sample and the analyzers is 2 meters. The analyzers have
a height of 140 cm and are mounted on goniometers sitting on air pads.
This allows for a fast change of the analyser configuration. Three different
analyser configurations are available: The
advantages of this layout are: 1.
Exact backscattering at the monochromator, 2.
No losses in flux caused by the geometry , 3.
Energy resolution of the primary spectrometer independent of the neutron
guide beam divergence. IN16
has a neutron flux about five times higher than that of IN10. A
complete list of publications can found by clicking on 2004-1996
or 1996-1992. IN16
Analyser Plates
3.1.8 The
HFBS Backscattering Spectrometer at NIST This
first backscattering instrument that uses the principle of phase space transformation
(PST) explained in section 3.1.1. Therefore the flux of this
instrument is increased and is somewhat higher than that of IN16. Due to
the wide wavelength band of the primary beam hitting the PST, the signal
to background ratio is less favorable. 3.1.9 The Backscattering
Spectrometer at the FRMII: RSSM
click on the title above to get an animated view of the spectrometer This
chapter again belongs to the history. We mention it because it contains
some interesting aspects. The
instrument (see Fig. 8d) is a three axis spectrometer in which both
the monochromator and the analyser are replaced by a
special two-crystal setup.
The first crystal is oriented with a fixed Bragg angle of 90° - ε,
where ε ≥ ΔΘ+η. The second crystal serves as the
deflector of the backscattered neutrons. Energy scans are performed via
thermal expansion of the monochromator backscattering crystal like on IN13.
Therefore the energy range is rather limited compared to a normal TAS spectrometer,
however, the Q resolution is as good. The flux at the sample position is
as low as expected for a monochromator in backscattering geometry. One
problem with this setup resides in the fact that the deflector crystals
are crossed by the primary beam before the neutrons hit the backscattering
crystals. On the monochromator side this implies background problems created
by the white neutrons scattered by the deflector. Therefore severe 'selection
rules' have to be employed in the choice of the deflector material : 1.
Small incoherent and absorption cross section. 2.
Need of single crystals: Pyrolytic graphite cannot be used because of
the disorder in the a-b planes. For
the analyser the problem is less critical because its deflector is hit only
by monochromatic neutrons. CaF2 crystals
with (422) orientation were used as backscattering crystals. The monochromator
deflector is a silicon crystal with (331) orientation and an anisotropic
mosaic spread (ηv = 5', ηh =
20 ′). The analyser deflector is pyrolytic graphite with η
= 20′. The energy resolution was 10 μeV (FWHM), the energy
range ± 120 μeV and the flux about 104
neutrons/cm2s. Applications were limited to high energy resolution
studies around the elastic line such as critical scattering near phase transitions
or truly elastic measurements, i.e. the separation of elastic from inelastic
scattering with μeV resolution. The
Brookhaven BS TAS monochromator click
on the title above to get more information about this method, which has
been introduced by B.Alefeld. For
completeness we mention the case of Backscattering of X-rays which
is as old as backscattering with neutrons [2.26]. History Fig.
14. Schematic drawing of a backscattering spectrometer for X-rays. 1.
Exact backscattering is not feasible with X-rays (having the velocity
of light) in contrast to neutrons, 2.
The absolute energy resolution in the case of X-ray backscattering from
perfect crystals neglecting the geometry term is given by: Therefore
in the X-ray case the absolute energy resolution is inversely proportional
to τ, or in other words it improves by going to higher
order reflections in contrast to the neutron case (see section 2.1, Eq. 23).
The only limitation is the quality of the crystals, the absorption and not
to forget the geometry term ctg ΘΔΘ. In order to reduce
this latter to values smaller than 5.10-7, one has to go very close to 90°
and use very high collimation. But with the event of the development of
dedicated synchrotron sources and associated equipment (wigglers etc) very
intense X-ray beams with very high collimation are available. First
measurements of this kind have been published [2.35- 2.42]. A review
on inelastic scattering of X-rays with very high energy resolution has been
published by Burkel [2.70]. 3.2. Time-of-Flight BS Spectrometers The
principle of this spectrometer is shown in Fig. 7
It is an inverted time-of-flight spectrometer with a very long primary flight
path and a crystal analyser secondary spectrometer with a Bragg angle near
90°. This instrument was proposed by Scherm and Carlile in 1976. 3.2.1
The ISIS TOF-X Spectrometer IRIS
In the following we will describe the instrument IRIS, which is operational
since 1987 at the spallation source ISIS of the Rutherford Laboratory [2.43,
2.44]. It views the ISIS liquid hydrogen cold source via a 34 meter
long curved neutron guide which terminates with a 2.5 meter long supermirror
coated converging guide. At 6Å the flux at the sample is enhanced
by a factor of 2.8 due to this device. The flux at the sample position is
5.106 neutrons/cm2s
at 100 µA operation of the spallation source. At a distance of 6.4 meters
from the moderator a variable aperture disc chopper serves to define the
wavelength band to prevent frame overlap at the detector and to eliminate
pulses for the case when a wider energy transfer range is required. The
scattered neutrons are analyzed for energy and wavevector changes by an
array of pyrolytic graphite crystals in near backscattering (θ = 87.5°)
and a position sensitive detector. At
full ISIS frequency the wavelength window at the sample is 2.0 Å.
The energy transfer range spanned depends upon the phase of the chopper
with respect to the ISIS pulse. If the wavelength window is centered on
the elastic line an energy transfer range from +0.65 meV to -0.45 meV
can be observed. In downscattering only to the elastic line an energy transfer
range from +1.85 meV to 0.0 meV can be observed. Decreasing the
chopper frequency to 25 Hz increases this measuring window to 11.1 meV.
The maximum energy transfer range is limited by the short wavelength cut-off
of the curved guide to a value of approximately 15 meV. At this energy
transfer the resolution is ~80 µeV (FWHM) compared to 15 µeV
(FWHM) at the elastic line. It
is a feature of inverted geometry spectrometers that the measuring range
in neutron energy loss is very large compared with a direct geometry spectrometer
as a result of the opposite handedness of the (Q, w) loci. Direct geometry
machines achieve high resolutions by reducing the incident neutron energy
such that in the limiting case a very narrow energy transfer range with
only a small momentum transfer range is observable. Recently
a new analyser array consisting of mica crystals became available with an
energy resolution of 4 µeV (FWHM) for 9.5 Å neutrons.
The instrument has been and is used successfully to study single particle
motions of protons in a variety of materials in an energy range up to 1 meV
[2.59-2.68]. A full list of publications can be found on clicking here. An
instrument similar to IRIS is in operation at KENS in Japan [2.45]
. A new instrument is in construction at the SNS in Oak Ridge. A TOF-X spectrometer
called OSIRIS is in operation at ISIS. It operates with polarized neutrons. 3.2.2
The SNS TOF-X Spectrometer 3.2.3 The
ISIS TOF-X Spectrometer OSIRIS 3.2.4 The TOF-X Spectrometer
MARS at PSI 3.3.
Backscattering Diffractometers This
whole chapter belongs to the history . We describe these very specialized
diffractometers just for the sake of completeness. The
principle of the backscattering diffractometer was explained in section
2.4. As outlined in section 3.1.8, this type of instrument was first proposed
by Bottom [2.26] for X-rays, then adapted to neutrons by Alefeld [2.17]
and to X-rays by Sykora [2.27] and Freund [2.28]. We will limit the discussion
to neutron diffraction. 3.3.1.
Alefeld's Experiment In
1965, Alefeld was the first to verify experimentally the ideas about neutron
backscattering promoted by Maier-Leibnitz. A test setup was installed at
a vertical neutron guide tube of the Munich research reactor FRM [2.1].
A sketch of the instrument is shown in Fig. 15. Fig.
15. Schematic drawing of the first two-crystal backscattering diffractometer
installed at the FRM in Munich by Alefeld. Two
silicon crystals were adjusted in a distance of 3.8 m such that the
first crystal reflected the neutron beam with a Bragg angle of 89°.
After a fall height of 3.8 m, the beam was reflected again by a second
crystal with a Bragg angle of 89°. The neutrons were detected by a BF3
counter. The reflection curve (Fig. 16) was measured as a function of the
temperature difference between the crystals. Fig.
16. Reflection curve measured with two silicon crystals on the backscattering
diffractometer of Alefeld. 3.3.2.
Double Crystal Neutron BS Diffractometers at the FRM in Munich Alefeld
[2.17] and later others [2.46 - 2.55] used the principle outlined in the
preceding section to construct backscattering diffractometers dedicated
to high precision measurements of relative lattice parameter changes. The
first neutron BS diffractometer ( thesis B.Alefeld) to measure the lattice
parameter variation of SrTiO3 The
principal layout of the backscattering diffractometer is shown in Fig. 5.
Two versions can be distinguished, using either transmission or reflection
geometry. In both cases the two crystals are aligned with the lattice planes
parallel to each other and with a Bragg angle near or equal to 90°.
The diffractometers developed in Munich were working in transmission geometry
and used the Doppler effect for the scan. Alefeld [2.17] developed a rotating neutron counter to achieve exact
backscattering. This system was abandoned on instruments of the next generation
[2.48] because of technical problems. From that time on a simple neutron
guide switch was used whereby Bragg angles of about 89.5° could be achieved. The
BS diffractometers in Munich have been used to study with high resolution
relative lattice parameter changes of the following systems: 1.
Second order phase transitions.
Examples: SrTiO3, KMn F3,Ni[2.17,
2.48 2.51, 2.55]. 2.
First order phase transitions at the melting point.
Examples: Na, K [2.50, 2.51, 2.54]. 3.
Order-disorder phase transition in ice [2.53]. Similar
experiments have been performed also at the ILL on the backscattering spectrometer
IN10 [2.56, 2.57]. 3.3.3.
The Backscattering Diffractometer S21 at the HFR in Grenoble For
completeness, we mention the double crystal diffractometer S21 with reflection
geometry and Bragg angles of 80°. Diffraction scans are performed either
by thermal expansion or by rocking one of the two crystals [2.24]. 3.3.4. A Four Beam Transmission
BS Diffractometer Alefeld
and Springer improved the backscattering diffractometer in transmission
geometry by using a so-called four beam method [2.58]. The principle is
shown in Fig. 17. Fig.
17. Schematic drawing of the four-beam backscattering diffractometer [2.50].
The neutrons are detected in four counter tubes arranged around the primary
beam in a symmetric setup. It turns out that the accuracy of the relative
adjustment of the sample and reference crystals is compensated in first
order and that a second order correction can be performed easily. The method
was applied to Ga As crystals. An accuracy of about ± 10-7
was obtained with these crystals which have a Darwin width 1.6.10-6
for the (200) reflection.
4. Neutron Backscattering
Spectroscopy: Applications The
different fields of applications of high resolution neutron backscattering
spectroscopy are listed in the table below: 4.3 Critical Scattering near Phase
Transitions 4.4 Dynamics of Spin Glasses
and of the Glass Transition 4.5 Reorientational Motions
in Molecular (Plastic) Crystals 4.6 Dynamics of Liquid Crystals
and Molecular Liquids 4.8 Dynamics in Polymers and
Biological Model Systems 4.9 Diffusion Mechanisms in Metals,
Alloys, Intercalation Compounds and of Hydrogen in Metals 4.10 Molecular Motions on Surfaces N.B.This
sequence of subjects is not ordered by inportance of the subjects. Historically
the first applications of backscattering spectroscopy were studies of hyperfine
interactions (V2O3) and of viscous liquids (Glycerol).
They were followed by experiments in Jülich on liquid and molecular
crystals and on diffusion mecanisms in metals. Tunneling spectroscopy with
neutrons started also in Jülich. A
more or less complete list of publications obtained with BS spectrometers
so far can be found here. Hyperfine
interactions can be studied by high resolution inelastic spin-flip scattering
of neutrons. The theory behind this field can be reviewed shortly as follows
[4.1]: If neutrons are scattered spin-incoherently from nuclei, the probability
that their spins will be flipped, is 2/3. Due to the conservation of angular
momentum, the nucleus at which the neutron is scattered with spin-flip changes
its magnetic quantum number M to M±1. If the nuclear ground state
is split up into different energy levels EM, for example
by a magnetic field or an electric quadrupole interaction, the spin-flip
produces a change of the energy of the nuclear ground state i.e. a nuclear
spin excitation: This energy change is transferred to the scattered neutron.
The double differential scattering cross-section in the zero phonon approximation
is given by: where
e-2w is
the Debye-Waller factor and a' the spin incoherent
scattering length. For DM
we used a constant D independent of M. This is the case for a Zeeman split
nuclear ground state due to a magnetic field H: where
µ is the number of nuclear magnetons µk,
I the nuclear spin. Eq. 39 has been derived assuming no correlation between
the nuclear spin system and the lattice as well as no nuclear spin-spin
interactions. Neutron scattering cross-sections have been derived also for
the more general case where part of these correlations and interactions
have been taken into account [4.13]: We
can measure hyperfine interactions with neutrons provided that: 1.
The energy resolution is equal to or smaller than the hyperfine splitting. 2.
The spin dependent scattering length a' is sufficiently large to get a signal. Concerning
the first condition the lower limit of a detectable splitting is of the
order of 0.03 µeV or 8 MHz with backscattering spectrometers.
Table 4 shows a number of potentially usable nuclei for inelastic spin-flip
scattering. D is calculated for a magnetic field of 100 kOe. Table
4. Potentially usable nuclei for the study of hyperfine interactions by
high resolution inelastic spin-flip scattering of neutrons. A is the natural
abundance of the isotope, sinc and sabs
are the spin incoherent and absorption cross-sections. Delta is the
Zeeman splitting calculated for a field of 100 K0e. Fig.
18 Fig.
18 shows a characteristic example of a spectrum of neutrons scattered in
ferromagnetic cobalt [4.4]. Until now only four nuclei have been used to
measure hyperfine interactions with neutrons: Vanadium, Cobalt and Hydrogen
and more recently Nd.
Fig. 19 shows a spectrum of neutrons scattered from protons in Tb Fe2 H4
at 4.2 K [4.8]. Fig.
20 Fig.
20 shows the temperature dependence of the internal magnetic field at the
vanadium nucleus in V3 O7
[4.9]. In the following we compare the neutron method with Mössbauer
and NMR techniques. Mössbauer
Effect. Most nuclei in Table 4 are not Mössbauer isotopes. Therefore
a new class of substances is accessible with the neutron method. Although
the energy width of 57Fe is 9 neV
compared to the 300 neV neutron energy resolution, the sensitivity
to internal magnetic fields of a Mössbauer experiment in iron is roughly
the same as that of a neutron experiment in cobalt due to the higher nuclear
magnetic moment of cobalt. The neutron energy spectrum with its three lines
is simpler than the general rather complex Mössbauer spectrum. This
is advantageous for investigations of substances with more than one hyperfine
field or with field distributions. In the neutron case the Debye Waller
factor is close to unity even at room temperature. Therefore no intensity
problems arise at elevated temperatures. NMR
has the advantage of a very high resolution. However, from this a number
of difficulties arise, which do not exist in the neutron experiment. It
is often rather tedious to find an unknown resonance. This is especially
true in antiferromagnetic samples where no enhancement factor exists. Furthermore,
short relaxation times make the signal to noise ratio small. Investigations
of mixed systems in the high concentration range are often impossible and
magnetically hard materials are not easily accessible. The sensitivity of
the neutron experiment does not depend on relaxation times and enhancement
factors. Therefore all nuclei in a substance are contributing equally to
the signal and always the bulk properties are measured. NMR experiments
are performed at a momentum transfer of Q~0 Å-1 whereas the neutron experiments can cover a range in Q. Only
in the case of nuclear spin-spin correlations which have been neglected
in the derivation of Eq. 39, would different results be obtained by NMR
and neutron scattering. 4.3. Critical Scattering near
Phase Transitions Neutron
scattering has been used extensively to study phase transitions. Soft modes,
central peaks and critical scattering are the key phenomena observed in
these systems. Very high energy resolution is often required for these studies.
Critical quasielastic scattering has been observed in systems with order
-disorder phase transitions. It originates from the formation of clusters
of the ordered structure within the disordered phase [4.18]. The energy
width of this quasielastic component is proportional to the inverse of the
cluster relaxation time tc. The intensity and tc diverge at the phase
transition. This corresponds to a critical slowing down of fluctuations. An
investigation of this type of phenomenon has been performed on IN10 on the
molecular crystal paraterphenyl [4.18]. The molecules consist of three phenyl
rings which are in a non planar configuration. At Tc = 179.5 K
paraterphenyl undergoes an antiferrodistortive phase transition. The purpose
of the experiment was to study the temperature dependence of the cluster
lifetime tc at Fig.
21. Critical scattering in para-terphenyl near its phase transition:
a) directly measured spectra . b)
Data after Fourier transformation and deconvolution Fig.
21a shows spectra measured at three temperatures close
to the phase transition. The same data after Fourier transformation and
deconvolution is plotted in Fig. 21b on a logarithmic
scale. Apparently S(q = 0, t) cannot be described by a single
exponential. From the slope of ln S(0, t) at short times t one obtains the
line width G = 1/tc which is plotted in Fig. 22 as a function
of DT = T - Tc. Fig.
22. Quasielastic line width of the critical scattering in paraterphenyl
as a function of DT = T-Tc.
A linear behavior is observed. For this kind of investigation very high
resolution in energy is crucial. The
phase transition in paraterphenyl has also been investigated by quasielastic
incoherent neutron scattering [4.22, 4.23, 4.24]. Far above the transition
point the measured quasielastic spectra revealed the dynamics of an almost
random disorder of molecular orientation. In the neighborhood of Tc,
however, the quasielastic incoherent neutron spectra were clearly affected
by the appearance of orientational short-range order and critical fluctuations
of the orientational order parameter. The results obtained by high resolution
spectroscopy were analyzed in terms of a model involving orientationally
short-range-ordered clusters. The single-molecule residence time tR,
the cluster lifetime t0 and cluster concentration c, as defined
in this model, were determined as a function of temperature. Related
studies by incoherent neutron scattering had been carried out already much
earlier by Toepler et al [4.16] with single-crystalline NH4Cl
near its order-disorder phase transition. The complementary study on ND4Cl
single crystals on IN10 has also been published [4.21]. The
central peak phenomenon of SrTiO3 has been investigated
on IN10 by Toepler et al [4.15]. In a temperature range between Tc
and 4.4 Dynamics of the Glass
Transition in Spin Glasses and Molecular Glasses The
dynamics of disordered systems has been studied extensively in the past
by inelastic and quasielastic neutron scattering. Initiated by the paper
of Edwards and Anderson [4.31], high resolution neutron experiments were
undertaken by Murani et al [4.25] to investigate the phenomenon of the phase
transition (freezing) of spin glasses like Cux Mn1-x. These early measurements showed that the intermediate scattering
function S(Q,t) extends over many decades in time. A distribution of relaxation
times was observed. Therefore it was necessary to use several types of spectrometers
(Backscattering, TOF and Neutron Spin Echo (NSE)) to explore the broad range
of relaxation times. The quasielastic width G
of the scattering function of the amorphous spin glass Al2 Mn3 Si3 O12
[4.26, 4.29] is shown in an Arrhenius plot in Fig. 23. Fig.
23. The
study of the glass transition in molecular glasses has become and still
is a fashionable subject of research. Theoretical papers have triggered
high resolution neutron scatterers to investigate this problem experimentally
[4.32 - 4.45]. The physics behind the glass transition is related to that
of the freezing in spin glasses. Colmenero et al
have published a paper in 2004 which reviews the field of the glass transition. 4.5
Reorientational Motions in Molecular (Plastic) Crystals Molecular
(plastic) crystals have been investigated with the aim of understanding
the dynamic orientational disorder present in these systems. The most striking
feature in the high resolution neutron spectra observed in such experiments
is the appearance of incoherent elastic and quasielastic scattering. From
the Q dependence of the former (the elastic incoherent structure factor
EISF) we can get detailed information about the geometry of the orientational
motions. From the width of the quasielastic peak we obtain the dynamical
behavior of the orientational motions. High energy resolution is crucial
in these experiments in order to be able to separate clearly elastic from
quasielastic scattering. We will briefly present two examples from the numerous
experiments already performed [4.46 - 4.68]. The
measurement of the EISF of adamantane C10H16
in its plastic phase by Lechner et al [4.47] is a text book example on how
to extract the information about the geometry of the orientational motion
from neutron data (see Fig. 24). Fig.
24 Elastic incoherent structure factor (EISF) of adamantane measured on
IN10. - C4 Reorientations , - - - C3
Reorientations, ..... Rotational Diffusion which
has to be avoided very carefully. The conclusion of this study was that
the reorientational motion in adamantane at room temperature is probably
dominated by C4 rotational jumps with a correlation
time of 1.7.10-11 sec. The
motions of 1-cyanoadamantane C10H15
CN were investigated by Bee et al [4.62] on IN10 in the glassy phase obtained
by rapid quenching of the room-temperature orientationally disordered phase.
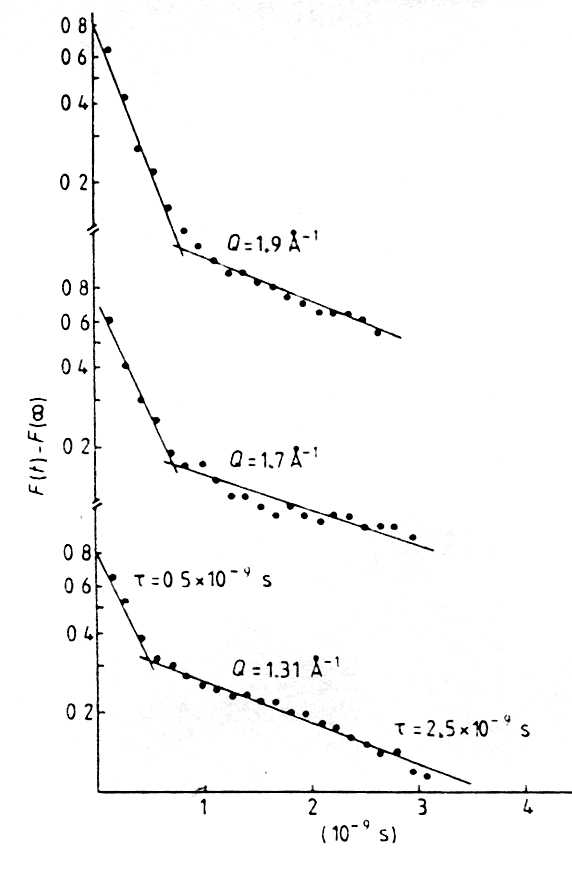
Fig.
25. Intermediate scattering function of 1-cyanoadamantane. From
a direct Fourier transform analysis (see Fig. 25) it was demonstrated that
the experimental data could not be described in terms of any simple jump
model involving a single correlation time. Instead the interpretation was
based upon a distribution of correlation times, a phenomenon mentioned already
in conjunction with the glass transition. 4.6 Dynamics of Liquid Crystals
and Liquids The
knowledge of the self diffusion coefficients in liquid crystals and molecular
liquids is important for the understanding of the flow properties of these
systems High resolution neutron spectroscopy using the backscattering technique
at small momentum transfers Q < 0.3 Å-1
is a very efficient tool for these studies. Small momentum transfers are
necessary in order to avoid the influence of rotational motions on the shape
of the quasielastic signal. Indeed earlier neutron experiments with meV
energy resolution and at higher momentum transfers have led to much too
high diffusion constants via a misinterpretation of the results. Using the
backscattering technique results could be obtained which were then in agreement
with tracer experiments or NMR spin-echo measurements. Fig.
26 Quasielastic line width of the liquid crystal TBBA at different temperatures
as a function of Q2.
Fig. 26 shows the quasielastic line width of the liquid crystal TBBA at
different temperatures as a function of Q2 [4.71].
The diffusion constant is obtained from the slope of the straight lines. Related
studies have been performed by Salmon et al [4.86, 4.87, 4.88] on the dynamics
of water-protons in aqueous ionic solutions. Since
1975 high resolution neutron spectroscopy has been used very successfully
to study rotational tunneling motions of small molecules, molecular groups
or ions like CH4, CH3 and A
first review of the field was given in 1981 by W. Press [4.146]. His
book describes the fundamental theory of neutron scattering from a quantum
rotor, mainly concentrating on CH3 and XH4
molecules and contains an almost complete list of references of the
work performed up to 1980. In the meantime considerable progress has been
achieved [4.147]. A more or less complete list of the investigated materials
containing published and unpublished results has been assembled by Prager
et al [4.148]. A complete list of publications of results obtained by backscattering
spectroscopy is given [4.89 - 4.145]. Typical spectra and results of a few
selected cases are shown in Figs. 28, 29 and 30. Fig.
28. Tunneling spectrum of NH4 ClO4
at 5 K measured on IN10. Fig.
29. Tunneling spectrum of CD4 at 3 K measured
on IN10. Fig.
30. Tunneling spectra of a) CD3 groups, b) CH3
groups in lithium acetate measured on IN10 and IN13 respectively A
compilation of high resolution inelastic neutron scattering in the domain
of tunneling spectroscopy has been published by Prager et al.: 4.8
Dynamics in Polymers and Biological Model Systems First
exploratory high resolution QNS experiments using the backscattering technique
were performed in 1974 on poly-dimethyl-siloxane (PDMS) at small momentum
transfers [4.149]. Later studies were made on polymers in melts and solutions
and on monomer molecular motions in micellar aggregates [4.150 - 4.156].
Ferroelectric copolymers were investigated recently by Legrand [4.157, 4.160]. From
about 1980 on the neutron spin echo technique became available with the
NSE spectrometer IN11 at the ILL [2.24]. It turned out rapidly that this
technique is ideally suited for the study of slow collective motions in
polymers via coherent quasielastic neutron scattering in the time
domain at small Q > 0.02 Å-1.
But spin incoherent QNS using backscattering spectrometers remains
very useful and complementary tool for studying the single particle motions
in these systems. Going
a step further in complexity, biological model systems have been investigated
by high resolution neutron scattering [4.161-4.167]. The interpretation
of the results is extremely difficult and the amount of information obtained
very limited. However the hope is that in combining measurements with different
high resolution neutron spectrometers on samples under various conditions
of temperature, humidity, isotopic substitution, etc. and by comparison
with molecular dynamics simulations one will be able to extract significant
information on the dynamics in these systems.An review of this field has
been published by Zaccai.
An introduction into the field of biological systems studied by neutron
scattering by Pynn can be found on the web. Neutron
scattering applications to biotechnology are discussed by Byron
and Gilbert. 4.9 Diffusion
Mechanisms in Metals, Alloys, Intercalation Compounds and of Hydrogen in
Metals Backscattering
spectrometers have extended the measurement range of diffusion constants
down to values of 10-8 cm2/s
and of relaxation times up to a few 10-9 s. This
fact made it possible to investigate diffusion and jump processes by QNS
not only in liquid and liquid like systems, but also in solids, like metals
below the melting point [4.171, 4.175, 4.192], fast ionic conductors [4.174],
intercalation compounds [4.172, 4.176] and hydrogen and impurities in metals
[4.198 - 4.224]. From experiments on single crystals at larger Q (2 to 4
Å-1) information on the single step of
the diffusion is obtained, e.g. the jump vectors and the space distribution
of the atoms over the interstitial sites. So
far only two pure metals, Na [4.175] and Ti [4.192] have been studied by
high resolution QNS on IN10. In both cases single- and polycrystalline samples
were used. Fig. 31 shows typical results obtained on single crystals of
bcc b-titanium below its melting point at
1680° C: Fig.
31. Quasielastic line broadening of neutrons scattered in bcc Ti single
crystals as a function of the scattering vector.
The quasi-elastic line width is plotted as a function of the momentum transfer
for different orientations a, the angle in the scattering plane between the crystal
<001> axis and the incident neutron wave vector. These results clearly
reveal that self-diffusion in b-titanium is dominated
by 1/2 [111] jumps into nearest neighbor vacancies. Very similar results
were obtained on solid sodium. Concerning the studies of motions of hydrogen
in metals, the fact that protons have a very high spin incoherent scattering
cross section makes it possible to investigate rather low concentrations
of protons down to 10-3 for backscattering spectroscopy and even
below 10-5 for TOF spectroscopy. Other
relatively non-absorbing nuclei which have rather high incoherent scattering
cross sections are listed in Table 5. All of these nuclei are possible
candidates for high resolution neutron studies of diffusional motions in
condensed matter. Table
5. Nuclei suited for high resolution neutron scattering studies of diffusional
motions in condensed matter. sinc is the incoherent scattering
cross section. 4.10
Atomic and Molecular Motions on Surfaces Spectroscopic
high resolution neutron studies of single particle motions on surfaces are
particularly difficult for of two reasons : the weak signal from the particles
moving on the surface (which is limited in size) and the strong background
signal from the substrate. Systems studied so far include motions of hydrogen
atoms chemisorbed on catalysts like Raney-nickel [4.225] and platinum zeolite
[4.227] and motions of small molecules like NH3
and CH4 adsorbed on graphite [4.228]. Both substrates mentioned
above have the advantage that rather large surface areas can be obtained
(of the order of a few m2) with samples
with a volume of a few cm3. Here even submonolayer
systems can give a sufficient neutron signal on backscattering spectrometers.
One problem in the data treatment of these systems arises from the fact
that the QNS scattering law cannot be described by a single Lorentzian but
rather by a more complicated function which has a logarithmic singularity
at 4.11 Dynamics of Hydrogen Bonds The
transfer of hydrogen atoms along preexisting hydrogen bonds is one of the
simplest chemical reactions and is important in many chemical and biological
systems. In a condensed phase the phonon coupling leads to a structural
rearrangement of the environment and modifies the reaction path. It also
provides mechanisms of relaxation for the system. Many carboxylic acids
form dimers linked by two hydrogen bonds, and the interconversion of the
two tautomer forms by a concerted two-proton transfer is governed by a rather
symmetric double-well potential. These materials are therefore good models
for the study of intermolecular hydrogen bonding and proton transfer reactions.
Amongst other techniques like NMR and Infrared, high resolution QNS can
be used to investigate these systems. Rather high momentum transfers are
needed because of the short jump distances of the order of 1 Å involved.
The scattering law can be derived by a semiclassical treatment of the two-site
jump model [4.59] and yields: Where
Fig.
32 Q-dependence of the intensity of the quasielastic intensity of neutrons
scattered from single crystals of acethylene dicarboxylic acid at 250 K. From
the data the jump-rate and jump-distance could be extracted, as well as
the occupation probability. The authors emphasized that no other experimental
technique is known to provide an equally detailed picture of the double
proton exchange process than high resolution QNS at high momentum transfers
on single crystals. Aerogels
are amorphous solids of high porosity, and, in some cases, are fractal,
i.e. there exists self-similarity of the inhomogeneities. This can be concluded
from small angle neutron scattering experiments. Porosity is not only a
structural characteristic of a solid, it rather affects also its dynamic
properties. It has been shown that above a crossover frequency wco,
the modes are no longer propagating (phonons) but localized vibrations which
have been called fractons. In this regime the vibrational density of states
g( Fig.
33 The
arrows indicate the derived values for the crossover energy. The spectra
consist of an elastic line superimposed on an inelastic contribution. The
shape of the latter depends on the mass density of the samples. The inelastic
signal for the low density aerogel exhibits a strong energy transfer dependence
which is equivalent to a deviation from a Debye density of states. The sample
with the high density, on the contrary, produces an energy transfer independent
inelastic contribution over the energy-range investigated, thus showing
Debye behavior. In contrast to theoretical predictions, no indication for
a hump in the crossover region has been found. Similar studies have been
pursued by Vacher et al [4.229] and many questions are still open. A
typical application of an offset monochromator is the high
resolution study of the roton minimum of He4 in the mK temperature range.
Here the excitation which has an energy of about 740 meV has been studied on IN10 (option 'IN10B') using a NaF111
monochromator in conjunction with the usual Si111 analyser with 0.7 meV
(FWHM) energy resolution. The shift and broadening was measured as a function
of temperature, pressure and isotope composition ( ie admixtures of He3
in He4). The roton minimum has also been investigated in Aerogels. The figure
below shows a comparison between the exitations measured in bulk He4 and
of He4 in an aerogel. with
the courtesy of the authors: Andersen et al 5.1 Precision Measurement of h/mn 5.2 Backscattering and Polarisation 5.3 Neutron Magnetic Resonance
Shift 5.1. Precision Measurement of h/mn In
1968 Stedman proposed to use two synchronously vibrating crystals in backscattering
geometry for the accurate measurement of the neutron velocity in order to
set up a new standard of the lattice constant of silicon [5.1]. By combining l = 2d for backscattering
and the de Broglie relation vl = h/mn
, we obtain d = h/2v mn. The main problem
of this method is to control the strains of the two crystals which are induced
by the strong accelerations up to 24 000 m/sec2. In 1981 the lattice constant of silicon was measured
by means of a combined scanning X-ray interferometer and a two beam optical
interferometer [5.2]. A value ao = (543102.018±0.034)
fm, which corresponds to an accuracy of 0.063 ppm, was obtained. Since
d is now the best known quantity in de Broglie's relation the accurate measurement
of v now serves to increase the accuracy of the ratio h/mn. At
the ILL an experiment was set up by Krüger, Nistler and Weirauch [5.3]
where also backreflection from a silicon crystal is used to define the wavelength
. The principle of the method is shown in Fig. 34. Fig.
34. Instrument setup at the ILL to measure the ratio h/mn. 5.2 Backscattering and Polarization The
Hamiltonian of a neutron in a magnetic field where
In
1976 Funahashi proposed to combine the high resolution of backreflection
and the Zeeman splitting of neutrons in a magnetic field to produce a highly
monochromatic polarized neutron beam [5.5]. A schematic drawing of his high
resolution neutron polarizer is shown in Fig.35.
Fig.
35 Funahashi backscattering polarizer. Fig.
36. Longitudonal Stern Gerlach effect measured with a backscattering setup
of silicon (111) crystals. This
spectrum represents the resolution of the experimental set- up. In the lower
part of Fig. 36 a field of about 2 Telsa was applied at the second
crystal. A clear indication of two split lines which correspond to different
polarizations is visible. For
the production and use of an energy modulated polarized beam for a backscattering
spectrometer it is easier to use two crystals with an offset of mH and to
perform the energy scan by a simultaneous temperature change of both crystals. It
should be mentioned that Zeyen et al [5.7] also obtained a clear separation
of the Zeeman-lines by using the double crystal diffractometer S21 with
conventional Bragg angles. With these experiments however it is not possible
to obtain the good wavelength resolution needed for a backscattering instrument. Backreflection
and transmission of the two Zeeman levels of ultracold neutrons by a monocrystalline
magnetized iron foil has been used by Herdin et al [5.8] to demonstrate
the efficient polarization of ultracold neutrons. 5.3 Neutron Magnetic Resonance
Energy Shift (nMR) and Backscattering Neutron
magnetic spin resonance is mainly applied for the search and determination
of fundamental properties of the neutron such as its magnetic moment [5.9]
or its electric dipole moment (EDM) [5.10]. Kendrick et al [5.11] have studied
the possibility of using nMR for a pulsed-neutron-polarization-inverter.
As an active component of neutron optics, nMR was first discussed by Drabkin
and Zhitnikov [5.12] and later in more detail by Krüger [5.13] and
by Badurek et al [5.14]. This component shifts the kinetic energy Ekin
of the two polarization states by ± 2 µHo.
An unpolarized neutron beam entering a magnetic field Ho is separated into two polarized sub-beams. Energy conservation
demands that the kinetic energy of the two sub-beams is changed by an amount
corresponding to the potential energy change ± µHo.
When leaving the magnetic field, the inverse change of the potential energy
and correspondingly the kinetic energy occurs. Therefore the neutron kinetic
energy (and the potential energy) has not changed after passing through
a magnetic field. However if the polarization direction of the two sub-beams
is inverted within the magnetic field Ho by a time-dependent
magnetic field H1, an effective potential energy change
of ± 2 µHo occurs.
Thus the kinetic energy change of the two sub-beams when entering
and leaving the magnetic field Ho is additive. As
a result the two sublevels, after the neutrons have passed this neutron
magnetic resonance device, are energetically separated by DE = 4 µHo.
Energy conservation is assured by photon creation and annihilation, respectively.
The flipping probability with and
t is the time during which the time-dependent rotating field H1
acts on the neutron. In
order to obtain If
the neutron velocity vo is fixed, then either the
length of the hf-coil or the amplitude H1 of the rotating
field has to be matched in order to obtain a p-turn. An
experiment to measure the nMR energy shift was performed at the p
spectrometer in Jülich [2.5, 5.17]. Fig. 37 shows a sketch of the experimental
set up. Fig.
37. Experimental backscattering setup to measure the neutron magnetic resonance
shift.
A monochromatic unpolarized neutron beam was backscattered from the crystal
Si1 and deflected to the electromagnet containing an hf-coil in the flight
direction of the neutrons and perpendicular to Ho.
After passing the hf-coil, the energy of the neutrons was analyzed by the
silicon analyser Si2 in backscattering. The energy scan was achieved by
Doppler moving the monochromator Si1. After the nMR had been established,
the voltage of the hf-coil was turned off and by Doppler moving Si1 a resolution
measurement was performed which is shown in the upper part of Fig. 38. After
switching on the hf-coil, the nMR energy shift was determined, which is
shown in the lower part of Fig. 38. Fig.
38. HF induced change of energy distribution of backscattered neutrons measured
with the modified Several
applications of nMR are conceivable: a)
The observed effect can be multiplied in a multiple stage arrangement. b)
The energy splitting system may be an important component in the realization
of dynamical neutron polarization as proposed by Badurek et al [5.14]. c)
Cold neutrons can be slowed down to energies of the order of meV. 5.4
A perfect Crystal Storage Device The
storage and study of ultracold neutrons in a bottle is exciting in itself
and is used mainly in the study of fundamental properties of the neutron
[5.18, 5.19]. Recently Schuster et al have tested a new type of storage
device for cold neutrons which may act as a basic element for novel beam
tailoring [5.20]. As shown in Fig. 39, two (111) oriented silicon crystals
at both ends of a 1 m long monolithic perfect silicon crystal serve
both as total reflecting walls for 6.27 Å neutrons in backscattering
and as entrance and exit doors which can be activated magnetically. Fig.
39. Sketch of the perfect crystal backscattering storage device installed
at the ISIS neutron source. Fig.
40. Response of the active perfect crystal storage system after opening
of the second crystal at the sixth back and forth reflection. Fig.
41. Response of the passive perfect crystal storage system. 6 -Future Prospects and Outlook a) BS Instruments under Construction
In previous sections we have described new BS instruments which are under
construction at the FRMII, at PSI and at SNS. The latter one should provide
a boost in intensity of one order of magnitude at a similar resolution of
existing instruments or a boost in energy resolution of one order of magnitude
with an intensity similar to existing instruments. This will be a big step
forward and will open new fields. This progress is coming from the fact
that the SNS source will have a peak flux at least one order of magnitude
higher than existing pulsed sources. Remember that neutron scattering is
a flux limited technique! The
instruments at the FRMII and at PSI will try to compete with existing instruments.
Their problem is the source one which they are installed. The flux of these
sources will not exceed those of existing comparable sources. BS
spectrometers on the ESS would have been the obvious choice. But
the ESS project has been pushed away into some uncertain future. What a
pity! There
are plans at the ILL to rebuild IN16 with the aim to gain a factor of 5
in flux by putting the instrument onto a better neutron beam and by using
phase space transformations. Remember the the ILL reactor still has and
will have in the foreseeable future the highest continuous cold flux in
the world! b) Technical Developments in BS 6.1 Gradient Crystal Monochromators One
intrinsic problem of BS spectrometers is the low incident flux as a result
of the narrow band width of the monochromator and analyser. Sometimes it
would be very useful to have a set of monochromators for a BS spectrometer
only differing in their A
third method to vary 1.
The true deformation ( 2.
The Doppler effect : Different volume elements of the crystal move with
different velocities at the same time. It
turns out that for cold neutrons in contrast to X-rays the second effect
dominates over the first one. It has been demonstrated experimentally [6.13]
on the backscattering spectrometer IN10, that an increase up to a factor
of 16 of the intensity backscattered from a perfect silicon (111) oriented
crystal as monochromator can be achieved easily in this way, accompanied
by a corresponding change of energy resolution from 0.3 µeV to
about 5 µeV (FWHM). The advantage of this method compared to
static gradients in mixed crystals is that one can tune the energy resolution
and intensity within a rather large range just by varying the power of the
ultrasound generator. 6.2 Multiplexing
Monochromators A
X-X BS spectrometer is an instrument matched to a continuous neutron source,
a TOF-X BS spectrometer one matched to a pulsed neutron source with short
pulses. Schelten [6.3] proposed a new type of X-X BS spectrometer called
'Musical' matched to the time structure of a pulsed neutron source with
long pulses. In
order to make full use of the peak flux of a pulsed source, the monochromator
consists of several crystals with the same orientation but slightly different
lattice spacings mounted behind each other at a distance s ('multiplexing
monochromator'). Each crystal reflects a slightly different wavelength.
Due to the path length differences the differently 'coloured' neutrons arrive
at different times at the sample. The
gain factor G of a 'Musical' backscattering spectrometer compared to a conventional
one on a pulsed source is equal to the number n of crystals of the multimonochromator.
In order to achieve a clear separation in time the distance s between two
adjacent monochromator crystals has to be 6.3 Ultrahigh Resolution BS Monochromators As
we have seen in chapter 2, the energy resolution of a BS spectrometer is
determined by the relation which
is valid for both the primary and secondary spectrometer. Both contribute
to the total resolution via a convolution. In an optimized intensity/resolution
layout the first and second term of Eq. 50 are matched. For Si (111) crystals
the primary extinction term yields DEext = 77
neV( see table 1). The geometry term of the spectrometer IN16
is 110 neV assuming a beam and sample size of 3 x 3 cm2. Alefeld
and Springer recently investigated GaAs crystals on a BS
diffractometer [2.58]. The intrinsic theoretical line width of the (200)
reflection (2d200 = 5.86 Å) is 8 neV,
see table 1), i.e. 10 times narrower than that of
Si (111). The measured deconvoluted linewidth obtained by Alefeld et al
[2.58] was about 25 neV. Very similar experiments on GaAs performed
by Liss et al [6.5] yielded a deconvoluted line width of about 15 neV, only
a factor two larger than the theoretical value. The additional experimentally
observed line width may be caused by several factors such as the crystal
alignment errors, the temperature instability or the crystal imperfection. It
has been proposed [6.8] to use GaAs (200) crystals as monochromator and
analyzers for a BS spectrometer with a geometry similar to that of IN10C.
However in order to match the geometry-related line width to the one caused
by primary extinction, a small sample size of only 1 x 1 cm2
(instead of 3 x 3 cm2 for Si (111))
can be used. The small sample size together with an intrinsic line width
of GaAs 10 times narrower than that of Si would result in an intensity loss
factor of about two orders of magnitude! There are however possibilities
to overcome this problem. We mention three ideas: 1.
Better geometrical focusing devices allowing a beam concentration by
one order of magnitude in both, x and y directions. At present such
a device does not exist since it does require very high quality supermirrors. 2.
Devices for phase space transformations could be used. 3.
Use of the correlation between the direction and magnitude of the wave
vector of neutrons backscattered from perfect crystals (see Fig. 44a)
: This correlation can be maintained in a BS spectrometer if (i) between
the BS monochromator and the sample there are no beam tailoring devices
and if (ii) a flat sample is placed in the bisecting orientation between
the incident and scattered beam. In this case the energy resolution
becomes independent of the beam divergence and is only determined by
primary extinction. This concept is available in principle on
IN16. Fig.
44a Correlation between direction and magnitude of
the wave vector of neutrons backscattered from a perfect crystal. Using
this trick one could in principle obtain an energy resolution in the best
possible case of DEext times a convolution factor f. This latter is 2 for
Lorentzians, 1.4 for Gaussians and about 1.2 for Ewald or Drawin curves.
Therefore one could hope to achieve a resolution of about 100neV with Si111
and 10 neV with GaAs200. However one must remember that those values can
only be reached by using perfect crystals in a perfect focussing
geometry. Tests on IN16 with Si111 reached so far an energy resolution of
about 200 neV in the best case.
We have explained the principle and applications of backscattering of neutrons
(and X-rays) from crystals. We have described the different kinds of backscattering
diffractometers and spectrometers. We have seen that neutron backscattering
has opened a new field, the µeV- spectroscopy, in inelastic neutron
scattering with many different applications ranging from hyperfine interactions
to rotational tunneling. The
neutron backscattering technique is now very well established after more
than 30 years of experience and experiments. It is a pleasure for those
who were lucky to start to work in a totally unexplored field of neutron
scattering in the sixties to see how this field has expanded since in the
technique and in the applications. The jung thesis students at the FRMI
are now retired. They look with amazement at the avalanche the idea of Maier-Leibnitz
which they put into realization has created. A
short comparison between neutron backscattering and neutron spin echo spectroscopy The
figure below shows the time-distance scales probed by many different techniques.
It includes the domain of neutron scattering and shows the areas covered
by BS and NSE spectroscopy. The latter techniques overlap but NSE is penetrating
well into the nanoeV region, whereas the BS technique works mainly in the
meV range. They are also complementary to each
other: The domain of NSE is mainly quasielastic coherent scattering, the
domain of BS is mainly quasielastic and inelastic incoherent scattering
(see second diagram below ( also obtained from R.Pynn)). For more information
about NSE please visit the ILL web sites: http://wwwold.ill.fr/YellowBook/IN11/ http://wwwold.ill.fr/YellowBook/IN15/ Reference:
R.Pynn, private communication Reference:
R.Pynn, private communication The
figure above shows a typical tunneling spectrum of CH3 groups measured on
IN10 and its Fourier transformation into the time domain. Obviously a time
domain up to a maximum of 10 nanoseconds is available on IN10 in its highest
resolution mode.
This configuration
is used on the BS spectrometers at NIST,
at the FRMII
and for the IN16B project at ILL.


Two
experiments were carried out successfully in a completely new energy
transfer window with this spectrometer :
1. Quasi-elastic scattering in viscous Glycerol.
2. Nuclear spin excitations in V2O3.
With this experimental breakthrough the term ' microeV'
was coined in neutron scattering.
The Munich BS instrument was dismantled shortly after these
experiments. But based on the new experience gained, later more
powerful BS spectrometers on reactors with much higher cold neutron
flux were built and used. Many papers have been published since using
BS spectrometers despite the fact that 35 years ago there had been a
lot of skepticism about the usefulness of this new technique. But Maier-Leibnitz
was right when he said that a new experimental technique
which allows to gain more than one order of magnitude on some
factor will open access to new fields in science.

a white neutron beam is guided by a Ni coated glass guide to the silicon
monochromator mounted on a velocity drive. The backscattered neutrons are
deflected by a graphite crystal to the sample. The energy of the scattered
neutrons is analyzed by the spherically curved silicon analyser crystals.
The neutrons are detected by counters placed close to the sample. The analyser
crystals, the sample, and the detectors are protected by a large shielding
house. The deflecting graphite crystal has an area of 3 x 3 cm2, compared to the guide cross section of 10 x 10 cm2.
In this way 9/10 of the 'right' neutrons first pass the deflecting crystal;
from the back-reflected neutrons 100 % are available of the flux hitting
the deflecting crystal. The analyser crystals were adjusted at different
scattering angles and measurements at five different Q-values could be performed
simultaneously. The instrument could be operated in two modes, with polished
or with unpolished silicon crystals. The energy resolution was 0.3µeV
(FWHM) and 0.7 µeV, respectively, with 2 to 3 times higher intensity
in the latter case.


The
secondary spectrometer of IN10 with A. Magerl

Option 'IN10B' of 'Off-set' Monochromators
on IN10:
Instead of using the Doppler effect for the energy scan thermal expansion
of the monochromator can also be used on IN10.( see section
2.3.2)
For further details see IN10.


'Artistic' view of one IN13 analyser

View
of the inside of the IN13 secondary spectrometer

Gradient Furnace of IN13
The
option of a gradient furnace for the monochromator has been used to
adapt the energy resolution to the problem under study. (This option
is no more available on IN13).

IN13 Secondary Spectrometer
IN16 was the first spectrometer of the second generation (see chapter 3.1)
for which the energy resolution is decoupled from the guide divergence (others
are HFBS and RSSM). The spectrometer is located at the H53 guide on the
horizontal cold source of ILL. A coarse wavelength band is extracted from
the primary guide by a double deflector setup and is offered in nearly exact
backscattering to the Doppler monochromator.

This spherical monochromator (5.5 kg on aluminium support) is mounted on
a mechanical crankshaft velocity drive operating at a variable frequency
of maximum 14 Hz and a constant amplitude of ±25 mm, which allows
for ±15 μeV energy transfer. Click here to see a movie of the
Doppler drive, which is composed of two symmetric machines operating in
opposite direction in order to minimise vibrations. Doppler
movie . ![]()
– polished, flat Si(111) analysers for high energy resolution (HWHM
= 0.2 microeV; both, the monochromator and the analyzers consist then of
many perfect (111) oriented silicon crystals with a size of 4 x 4 x 0.4 mm³
glued on spherically curved surfaces).
– deformed, unpolished Si(111) crystals of size 6cm and 0.75 mm thickness.
– (the total number of analyser crystals is of the order of 450 000 !
Energy scans in a rather large window of 60 µeV are possible.
The NIST WEB site dedicated
to this instrument contains very detailed information about all technical
aspects and a complete list of publications of experiments carried out with
this spectrometer. The instrument is described in full detail in a recent
review article.
This instrument is under construction at the new research reactor
FRMII close to Munich. Again it uses the principle of phase space transformation
in order to increase the flux. The monochromator is mounted on a new
Doppler drive which uses a powerful linear motor. Velocities up to
4.7 m/s are possible. The spectrometer should be operational in the
near future. Look at the very nice WEB site to get very
detailed information on the construction of this new instrument and a list
of publications.

Schematic view of the Doppler drive
3.1.10 . The Three Axis BS Spectrometer at the HFBR Brookhaven
The idea behind this spectrometer proposed by Axe, Moncton and Passell [2.25]
in 1983 is to use backscattering as an option on a conventional three axis
spectrometer in order to obtain very high energy resolution without loosing
the advantages of a three axis spectrometer, i.e. the flexibility, the ease
of selecting particular Q scans and the high momentum transfer resolution.

Larry Passell and one of the authors aligning the BS TAS monochromator
at HFBR.
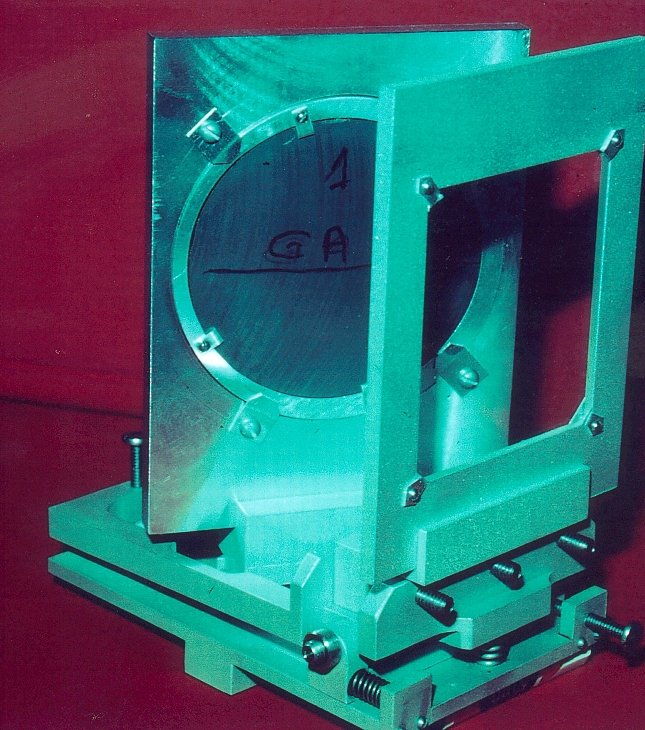
3.1.12.
X-Ray Backscattering Spectrometer
Bottom [2.26] was the first to propose X-ray backscattering as a means for
high resolution crystal diffraction work. Bottoms' idea was taken up by
Sykora and Peisl [2.27] for the construction of a 'first generation' X-ray
instrument for high precision measurements of relative lattice parameter
changes better than 10-6. Freund
et al developed a similar instrument [2.28]. Diffraction phenomena of X-rays
in the backscattering case were studied theoretically on the basis of the
dynamical theory of diffraction in several papers [2.29 - 2.31]. Later the
idea emerged to try high energy resolution X-ray spectroscopy using
the backscattering method, probably triggered by the very successful application
in the neutron case. First results were published in 1982 by Graeff and
Materlik [2.32]. They used a double crystal setup with two separate silicon
(111) crystals at a Bragg angle of 89,84°. The energy scan was performed
using thermal expansion of one of the two crystals. With the (888) reflection
they obtained a relative energy resolution of 5.3 .10-7 or in absolute units 8.3 meV. Similar results
were obtained by Egger et al [2.34]. Dorner and Peisl continued to develop
this method and proposed a real backscattering spectrometer for X-rays
[2.33]. This instrument is shown in Fig. 14.

It resembles very much a neutron backscattering spectrometer. There are
however a number of characteristic differences: (37)
(37)
Recent developments in X ray BS spectroscopy
Two X ray BS spectrometers are in operation at the ESRF in Grenoble
since a few years: ID16 and
ID28. The
diagram below shows the layout of these instruments.A full account
of the new research field these instruments are giving access to is available
at the ESRF. The interested
reader is referred to this site. 
X-ray BS spectrometer at the ESRF


It is clear from Fig. 16 that the curve is shifted from T1-T2
= 0. This shift was explained by the gravitational acceleration of
the neutrons over 3.8 m which leads to a measurable energy shift of
0.38 µeV . This observation confirms within 20 % accuracy that
the Hamiltonian for the neutron due to the gravitational force is m g h where
g = 9.81 m sec-2. With a dedicated experiment using the same technique
an accuracy of 1 % could be obtained. This result was confirmed later
with an accuracy of 1 % by measuring the phase shift of two coherent neutron
beams in an interferometer, propagating in different gravitational potentials.


Two domains can be distinguished, inelastic scattering and quasielastic
scattering. Studies of nuclear spin excitations and of tunneling motions
belong to the first category, all the others to the second, except maybe
the fractal experiments, where one measures the density of states of excitations.
In most of the above mentioned applications one investigates single particle
motions via incoherent scattering. There are however significant exceptions
like critical scattering near phase transitions, spin glasses and in some
cases studies of the glass transition where one looks at collective phenomena.
An excellent review about high resolution quasielastic scattering was written
by M.Bee.
![]() (38)
(38) (39)
(39) (40)
(40)
Isotope
Spin
![]()
![]()
A
%
![]()
1H
1/2
79.9
0.33
99.98
1.77
2H
1
2.04
0.0005
0.015
0.27
7Li
3/2
0.68
0.045
92.5
0.69
23Na
3/2
1.59
0.53
100.0
0.47
25Mg
5/2
0.27
0.19
10.0
0.11
35Cl
3/2
4.6
44.1
75.7
0.17
39K
3/2
0.23
2.1
93.0
0.08
45Sc
7/2
4.67
27.2
100.0
0.43
47Ti
5/2
1.5
1.7
7.3
0.10
51V
7/2
5.07
4.9
100.0
0.46
53Cr
3/2
5.85
18.2
9.5
0.10
55Mn
5/2
0.40
13.3
100.0
0.43
59Co
7/2
4.83
37.2
100.0
0.42
65Cu
3/2
0.40
2.17
30.8
0.50
67Zn
5/2
0.28
6.8
4.1
0.11
105Pd
5/2
0.80
20.0
22.3
0.08
127I
5/2
0.31
6.2
100.0
0.35
133Cs
7/2
0.21
29.2
100.0
0.23
139La
7/2
1.15
8.9
99.2
0.25
165Ho
7/2
0.36
64.7
100.0
0.36
171Yb
1/2
3.9
48.6
14.3
0.31
173Yb
5/2
2.47
17.1
16.1
0.08
143Nd
7/2
12.17

Fig.
19.

More recent publications concerning Nd compounds can be found by clicking here. Spectra of NdCu2
obtained at various temperatures are shown below:
![]() .
.
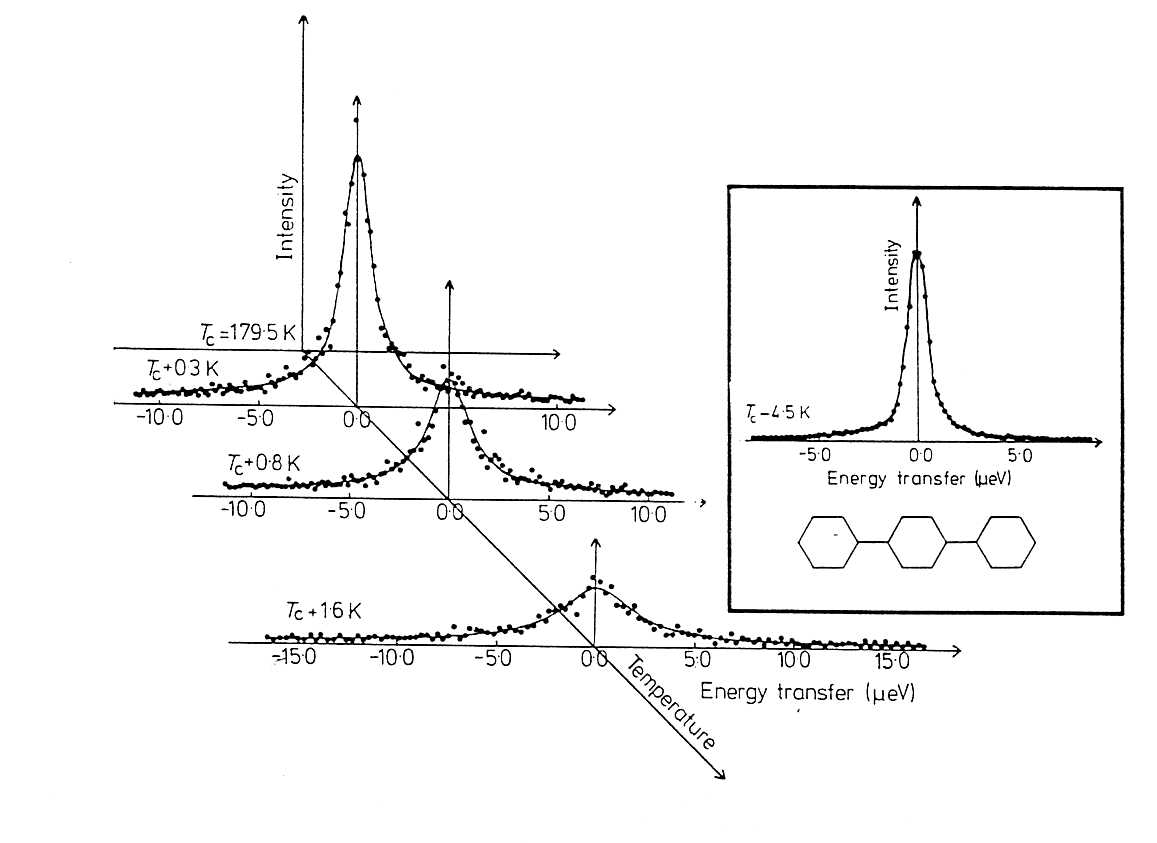


Tc + 12 K no line broadening was observed within an
experimental upper limit of 0.08 µeV.
The data of G between 0.01 and 10 µeV were obtained
with the backscattering spectrometer IN10.

The energy resolution in this experimental study on IN10 was so high that
the elastic incoherent intensity could be observed directly and the quasielastic
scattering contributed to the spectra in form of a flat background. The
difficulty in these experiments is related to the presence of coherent Bragg
scattering,


Fig.
27
Fig. 27 shows typical results obtained on an aqueous NiCl2
solution. The continuous curves are 2-Lorentzian fits, the HWHM of
both being plotted as a function of Q2, resulting in two diffusion constants D1 and D2. D1 is
called the diffusion coefficient of protons bound to the cation for a time
t1, D2 the
diffusion coefficient of the remaining protons in solution.
![]() in solids. It seemed at the beginning
that only a few materials show the effect of tunneling in the energy range
accessible to neutron spectrometers. The systematic research performed in
the meantime has shown that many molecules are weakly hindered from rotation
in the solid. Thus it was possible to study tunneling in various chemical
surroundings (ionic, van der Waals, metallic systems), as a function of
chemical substitution (isomorphous and/or deuterated compounds), bond length
and unit cell dimensions (pressure), the coupling to phonons (temperature)
and to other methyl groups, etc. The results gave a rather complete understanding
of rotational tunneling itself and of the effects or materials under investigation.
The method is very sensitive because the tunnel splitting is determined
by the overlap of the wavefunctions describing the different orientations
of a molecule which decays approximately exponentially with the potential
height. It is, however, only applicable to molecules with large rotational
constants (small momenta of inertia) e.g. protonated or deuterated small
molecules.
in solids. It seemed at the beginning
that only a few materials show the effect of tunneling in the energy range
accessible to neutron spectrometers. The systematic research performed in
the meantime has shown that many molecules are weakly hindered from rotation
in the solid. Thus it was possible to study tunneling in various chemical
surroundings (ionic, van der Waals, metallic systems), as a function of
chemical substitution (isomorphous and/or deuterated compounds), bond length
and unit cell dimensions (pressure), the coupling to phonons (temperature)
and to other methyl groups, etc. The results gave a rather complete understanding
of rotational tunneling itself and of the effects or materials under investigation.
The method is very sensitive because the tunnel splitting is determined
by the overlap of the wavefunctions describing the different orientations
of a molecule which decays approximately exponentially with the potential
height. It is, however, only applicable to molecules with large rotational
constants (small momenta of inertia) e.g. protonated or deuterated small
molecules.

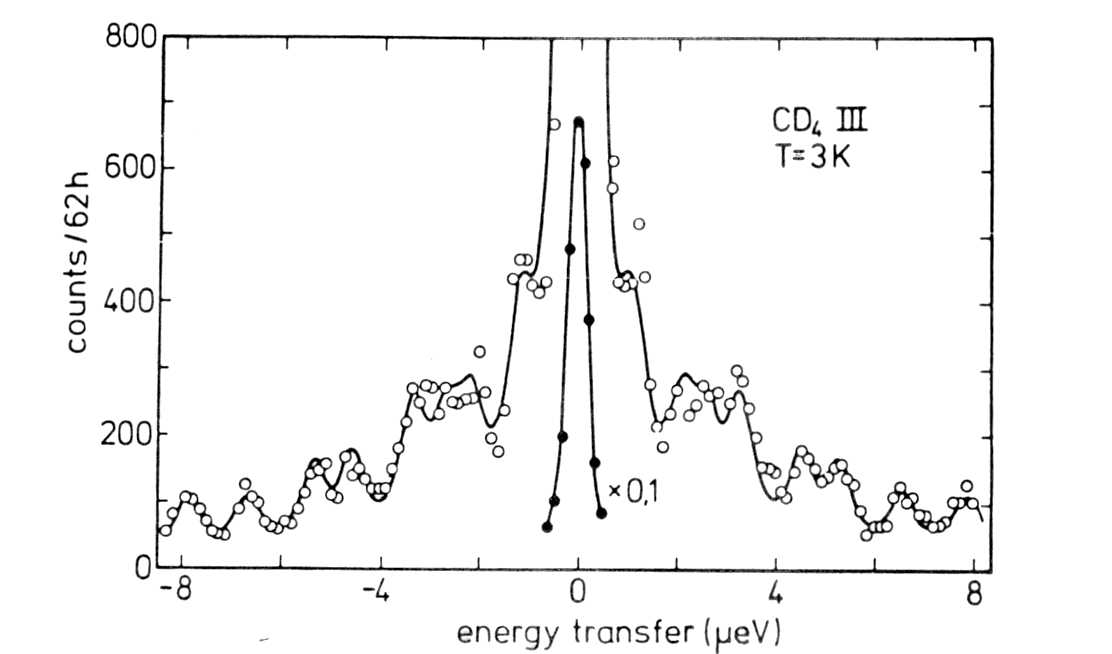

Rotational tunneling and neutron spectroscopy: A compilation,
Chemical Reviews Vol. 97 pp. 2933-2966, 1997
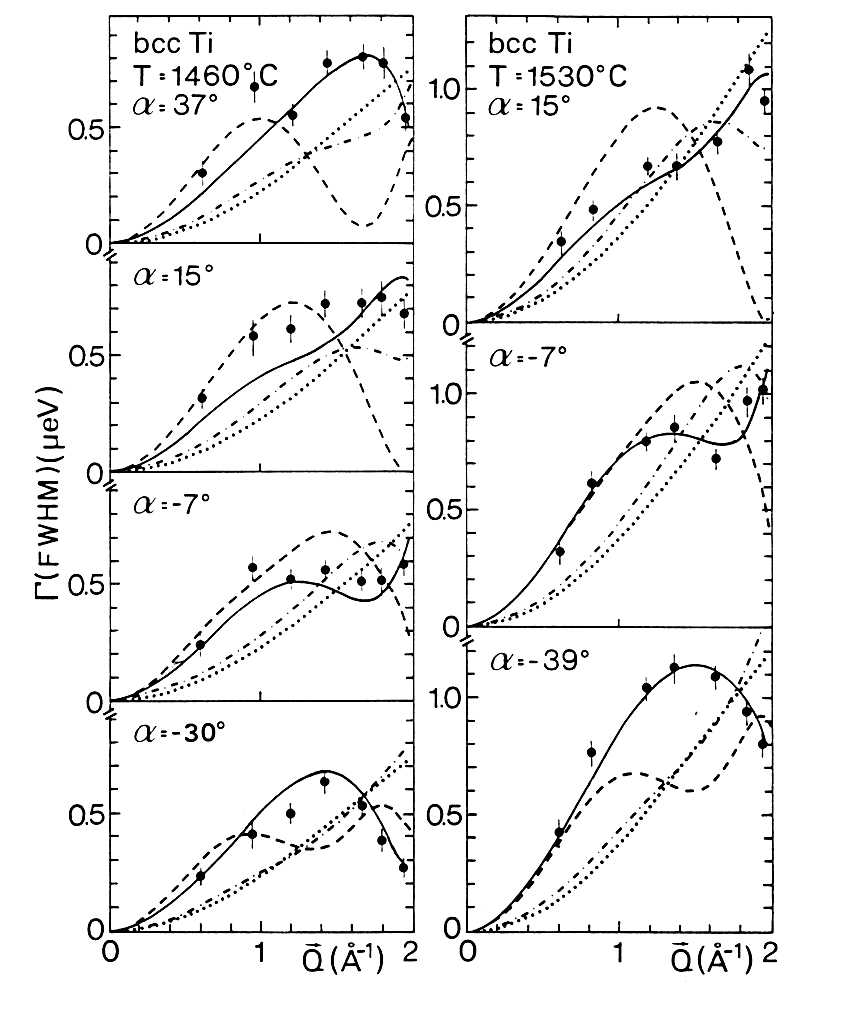
Element
![]()
![]()
1H
79.9
0.33
2H
2.04
0.00052
7Li
0.68
0.045
natN
0.52
1.9
23Na
1.59
0.53
natCl
5.20
33.5
nat
Ar
0.22
0.68
natK
0.39
2.1
45Sc
4.5
27.2
nat
Ti
2.87
6.09
51V
4.98
5.08
nat
Cr
1.82
3.07
55Mn
0.6
13.3
nat
Fe
0.39
2.56
59 Co
4.8
37.2
nat
Ni
5.0
4.5
nat
Cu
0.52
3.78
nat
Se
0.35
11.7
nat
Rb
0.30
0.38
nat
Mo
0.28
2.55
nat
Ag
0.56
63.3
nat
La
1.51
8.97
nat
Nd
11.0
50.5
nat
Dy
70.0
940
natYb
4.0
35.5
nat
Hf
2.6
104
natW
1.82
18.4
natPt
0.6
10.3
Lambda=1.8
A
![]() = 0 and
very long tails. This is due to the two-dimensional character of the diffusive
motions.
= 0 and
very long tails. This is due to the two-dimensional character of the diffusive
motions.
 (41)
(41)![]() (42)
(42) (43)
(43)![]() is the Debye-Waller factor, R the
proton jump vector between the sites A and B, Px is the equilibrium
occupation probability of the site x, and t is the residence time. Stoeckli et al [4.59] have performed
QNS experiments on IN13 to study several carboxylic acids in both single
crystal and polycristalline samples. Fig. 32 shows the Q dependence of S1
obtained for acetylene dicarboxylic acid.
is the Debye-Waller factor, R the
proton jump vector between the sites A and B, Px is the equilibrium
occupation probability of the site x, and t is the residence time. Stoeckli et al [4.59] have performed
QNS experiments on IN13 to study several carboxylic acids in both single
crystal and polycristalline samples. Fig. 32 shows the Q dependence of S1
obtained for acetylene dicarboxylic acid.

 ) is predicted to vary as
 ![]() , where d is the fractal dimension [4.229-4.231].
Inelastic neutron scattering provides a direct method to determine g(
). In the limiting case hw/kBT
<< 1 which is nearly always the case on backscattering spectrometers,
the intensity of inelastically scattered neutrons is proportional to which is a constant
for Debye solids, and which decreases with increasing
, where d is the fractal dimension [4.229-4.231].
Inelastic neutron scattering provides a direct method to determine g(
). In the limiting case hw/kBT
<< 1 which is nearly always the case on backscattering spectrometers,
the intensity of inelastically scattered neutrons is proportional to which is a constant
for Debye solids, and which decreases with increasing ![]() for fractal systems like aerogels. Due to the fact that in silica aerogels
the sound velocities cs are lower by more than one order of magnitude
compared to normal solids and that
for fractal systems like aerogels. Due to the fact that in silica aerogels
the sound velocities cs are lower by more than one order of magnitude
compared to normal solids and that  , it is possible to measure the
density of states of aerogels on backscattering spectrometers. Fig. 33 shows
typical spectra measured with the backscattering spectrometer BSS1 at Jülich
for two values of the momentum transfer Q and three aerogels of different
mass density ( g/cm3) [4.230].
, it is possible to measure the
density of states of aerogels on backscattering spectrometers. Fig. 33 shows
typical spectra measured with the backscattering spectrometer BSS1 at Jülich
for two values of the momentum transfer Q and three aerogels of different
mass density ( g/cm3) [4.230].


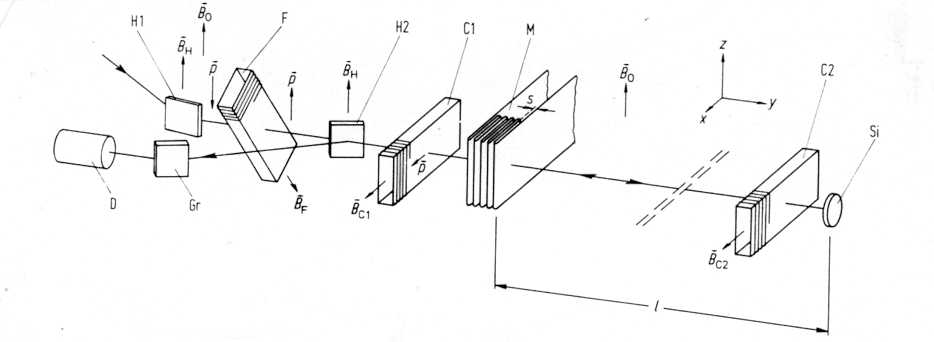
The neutrons are polarized by Bragg reflection from a Heusler crystal H1.
The polarization is modulated periodically with a meander coil M. After
a path of about 10 meters the neutrons are backreflected from a Silicon
single crystal Si with (331) orientation which defines the wavelength. The
neutrons subsequently pass the modulator M a second time. The velocity of
the neutrons is given by v = 2Dln where Dl
is the modulation length which is the distance between two intensity minima. n is the modulation frequency. In the experiment Dl is only 1mm. Therefore a large multiple of Dl (about 104) is measured in order to increase
the accuracy of the experiment. The most accurate value for h/mn
obtained by this method is h/mn= (3.9560344±0.0000016) 10-7m2
sec-1 [5.4].
![]() is
is (44)
(44)![]() is the neutron momentum
operator,
is the neutron momentum
operator, ![]() the neutron magnetic moment. If the magnetic field
the neutron magnetic moment. If the magnetic field
![]() is time independent, the
total energy is a constant of the motion and the change of the neutron momentum
is dependent on the orientation of the field gradients relative to the neutron
propagation direction. If the field gradient is oriented normal to the propagation
vector, we deal with the Stern-Gerlach effect which describes the transversal
separation of the two spin states. If the field gradient is parallel to
the neutron propagation vector, it produces a longitudinal change of the
neutron momentum which is connected with a change of the kinetic energy
of the two spin states. This always happens when neutrons pass from a field
free region into a space region with a magnetic field
is time independent, the
total energy is a constant of the motion and the change of the neutron momentum
is dependent on the orientation of the field gradients relative to the neutron
propagation direction. If the field gradient is oriented normal to the propagation
vector, we deal with the Stern-Gerlach effect which describes the transversal
separation of the two spin states. If the field gradient is parallel to
the neutron propagation vector, it produces a longitudinal change of the
neutron momentum which is connected with a change of the kinetic energy
of the two spin states. This always happens when neutrons pass from a field
free region into a space region with a magnetic field ![]() where
the change of the potential energy
where
the change of the potential energy ![]() inevitably implies an equivalent inverse change of the kinetic energy of
the neutron for its total energy to remain constant (Zeeman splitting).
inevitably implies an equivalent inverse change of the kinetic energy of
the neutron for its total energy to remain constant (Zeeman splitting).
A perfect crystal in backscattering orientation extracts a highly monochromatic
unpolarized neutron beam which penetrates into a strong magnetic field with
the field gradient parallel to the propagation vector. The two spin states
of the neutrons split into the energies Eo ± mH.
An analyser crystal situated in this field , whose lattice constant is tuned
(for example by temperature change) to one of these energies, reflects neutrons
only of one polarization state. A slightly different experiment was performed
[5.6] to verify this proposal. Instead of tuning the second crystal, the
first crystal was Doppler moved, in this way both polarization states were
measured simultaneously. The upper part of Fig. 36 shows an intensity spectrum
dependent on the Doppler velocity with zero magnetic field.

 of a particle
with spin 1/2 in a magnetic field Ho and a time-dependent,
rotating field H1 perpendicular to Ho
was calculated by Alvarez and Bloch [5.15], later by Rabi et al [5.16] and
by Kendrick et al [5.11] and is given by
of a particle
with spin 1/2 in a magnetic field Ho and a time-dependent,
rotating field H1 perpendicular to Ho
was calculated by Alvarez and Bloch [5.15], later by Rabi et al [5.16] and
by Kendrick et al [5.11] and is given by (45)
(45)![]() (46)
(46)![]() (47)
(47)![]() (48) = 1, the value
for t has to be
(48) = 1, the value
for t has to be ![]() . If this pulse-time for a p-turn
is replaced by the time of flight To = lo/vo of the neutrons through the hf-coil,
one obtains
. If this pulse-time for a p-turn
is replaced by the time of flight To = lo/vo of the neutrons through the hf-coil,
one obtains (49)
(49)

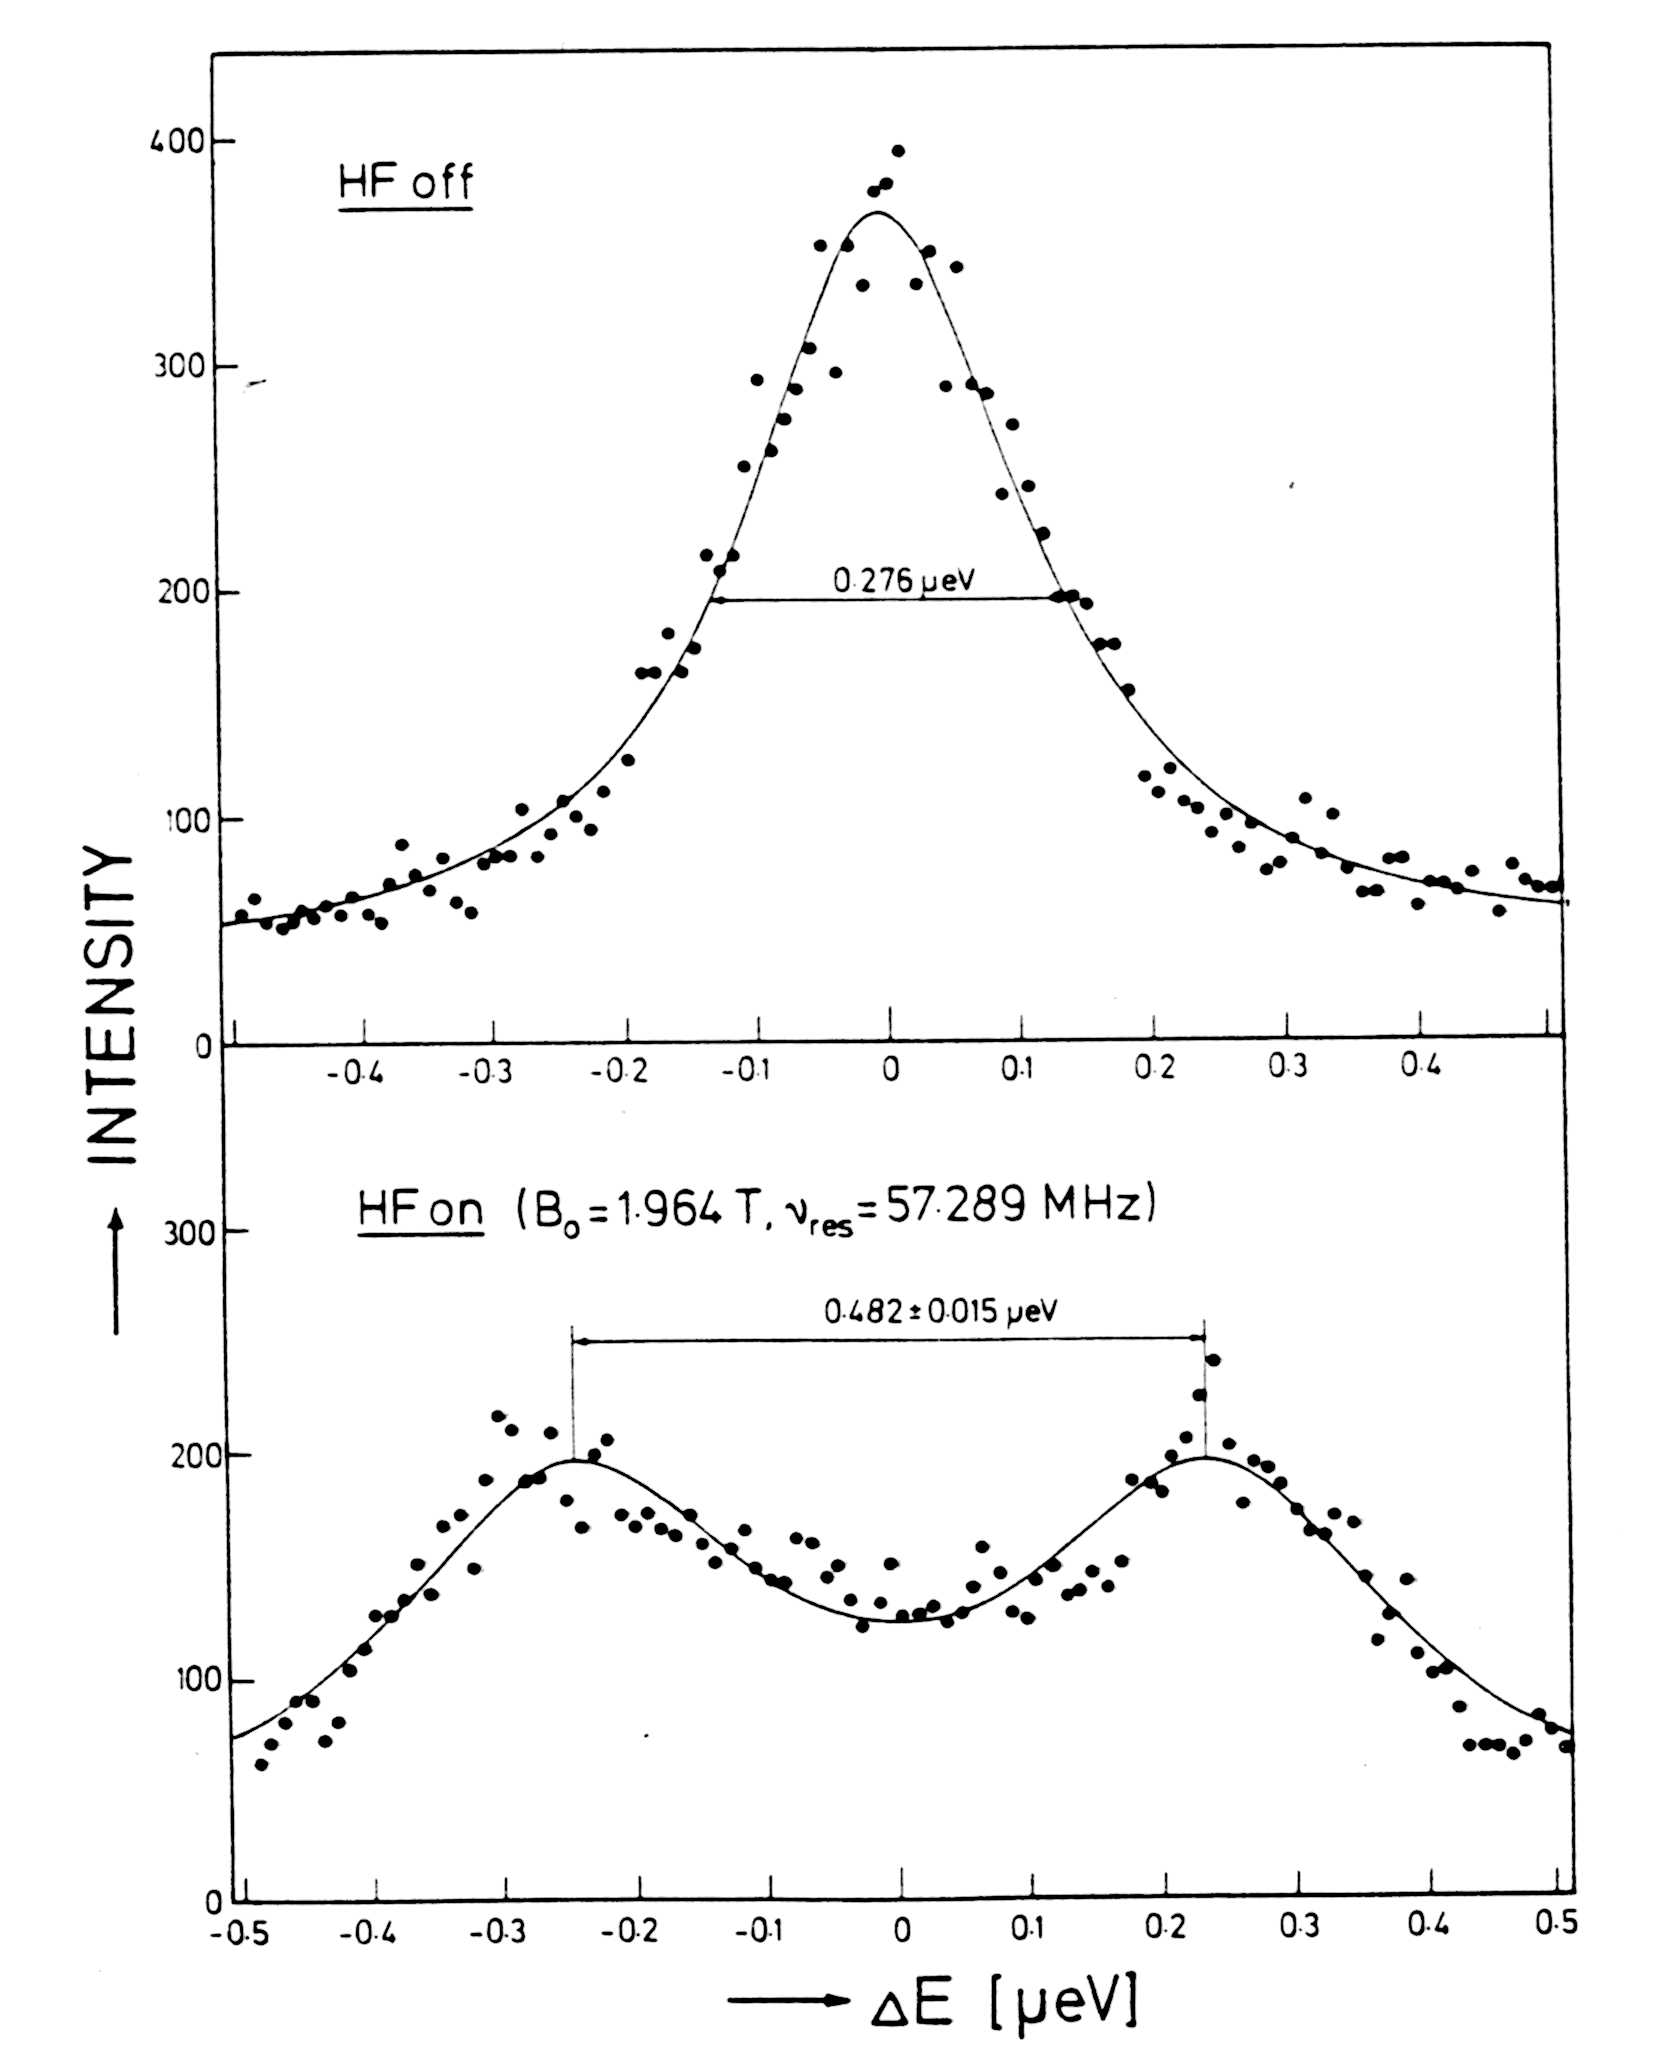
![]() -spectrometer
at the FRJ in Jülich.
-spectrometer
at the FRJ in Jülich.
Two energetically separated intensity peaks at ± 0.24 meV were observed in good agreement with the calculated
values of ± 0.237 meV. This result demonstrates the inelastic interaction
of a neutron with the time-dependent magnetic field of a nMR system.
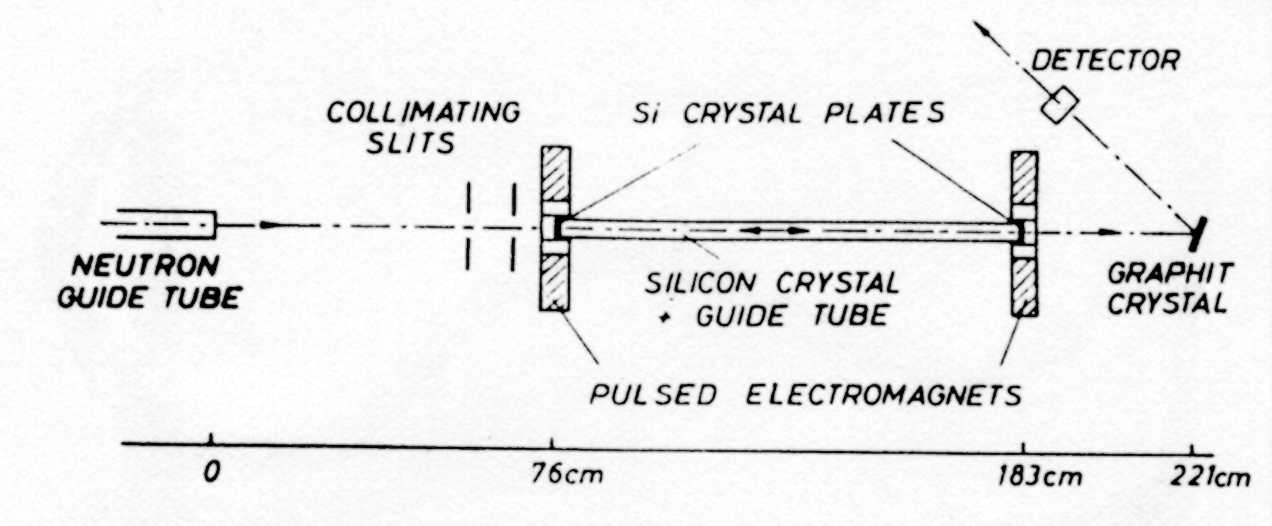
To reduce lateral losses a glass guide tube is adjusted
between the two crystal plates. The device was tested at the pulsed neutron
source ISIS at the Rutherford Laboratory. The system was filled with neutrons
by a synchronized magnetic pulse of 1.3 T applied to the first crystal.
Due to this pulse, the kinetic energy of the two polarized sub-beams is
shifted by ???? which corresponds to the width of the plateau of the Darwin
curve of Si (111). After the neutrons have passed the magnetic field the
energy has been shifted back and those neutrons which are reflected by the
second crystal are also reflected by the first, if the field H was switched
off before the neutrons come back to the first crystal. Fig. 40 shows a
measurement where the first crystal plate was magnetically opened every
two seconds and the second crystal plate was opened after six back and forth
reflections.

The intensity observed after opening the second crystal is about 1600 times
higher than in the case without magnetic switching (see Fig. 41).

Small satellite peaks are observed for the third, fourth, fifth and seventh
back and forth reflection which are caused by a finite transmittance of
the crystal in the closed state. Three further experiments have been proposed
by the authors to study this storage device in more detail. The device could
be filled with about 25 times more neutrons by storing one burst after the
other. Multiplexing the entrance and exit crystals is a possibility to enlarge
the wavelength band of the stored neutrons. To store polarized neutrons
a periodic spin flipper between the crystals could be used. Further experiments
have been performed recently [5.21].
![]() values, large
values, large ![]() yielding high intensity at the expense of energy resolution.
In real crystals
yielding high intensity at the expense of energy resolution.
In real crystals ![]() can be varied in several ways like by (i) the application of a temperature
gradient parallel to the neutron wave vector or (ii) by a concentration
gradient in mixed crystals. The first method has been investigated by Alefeld
[6.1] and it was later used by Heidemann et al [4.128] on the BS spectrometer
IN13. The second method can in principle be applied to mixed Si-Ge crystals.
Si and Ge have the same crystal structure with lattice parameters differing
by 4 % and are miscible over the full concentration range. The difficulty
however arises in the growth of single crystals for which one method has
been proposed by Magerl et al [6.2]. In principle it should also be possible
to produce Si-Ge crystals with a lattice parameter gradient. However a number
of technical problems have still to be overcome before a production of these
crystals will be possible.
can be varied in several ways like by (i) the application of a temperature
gradient parallel to the neutron wave vector or (ii) by a concentration
gradient in mixed crystals. The first method has been investigated by Alefeld
[6.1] and it was later used by Heidemann et al [4.128] on the BS spectrometer
IN13. The second method can in principle be applied to mixed Si-Ge crystals.
Si and Ge have the same crystal structure with lattice parameters differing
by 4 % and are miscible over the full concentration range. The difficulty
however arises in the growth of single crystals for which one method has
been proposed by Magerl et al [6.2]. In principle it should also be possible
to produce Si-Ge crystals with a lattice parameter gradient. However a number
of technical problems have still to be overcome before a production of these
crystals will be possible.![]() of a monochromator
is the application of ultrasonic vibrations to the crystal. Two effects
come into play :
of a monochromator
is the application of ultrasonic vibrations to the crystal. Two effects
come into play :![]() )def
(strains) induced by longitudinal lattice vibrations.
)def
(strains) induced by longitudinal lattice vibrations.
 where v is the neutron velocity and
 ![]() the pulse length of the source.
The optimum number of monochromator crystals is given by nopt
= T/2
the pulse length of the source.
The optimum number of monochromator crystals is given by nopt
= T/2![]() . T is the
period of the pulsed source. The factor 2 occurs because of the necessity
of discrimination between the directly scattered neutrons and those scattered
indirectly from the analyser. In order that the neutrons backscattered from
the different monochromators do not overlap energetically, the energy difference
between neutrons reflected from two nearest neighbor monochromators should
be larger than the intrinsic full width at half maximum of the Bragg
reflection of one crystal. This energy difference can be produced either
by the use of thermal expansion or by doping, thereby achieving different
lattice parameters. For perfect Si (111) crystals the temperature difference
between two adjacent crystals would have to be equal or larger than 9°C
( DEext = 77 neV, see table 1). The total energy
band width covered by the multi-monochromator nDEext is much smaller than the energy range of a BS spectrometer.
Therefore the center of gravity of this energy band has to be scanned either
via the Doppler effect or via thermal expansion.
. T is the
period of the pulsed source. The factor 2 occurs because of the necessity
of discrimination between the directly scattered neutrons and those scattered
indirectly from the analyser. In order that the neutrons backscattered from
the different monochromators do not overlap energetically, the energy difference
between neutrons reflected from two nearest neighbor monochromators should
be larger than the intrinsic full width at half maximum of the Bragg
reflection of one crystal. This energy difference can be produced either
by the use of thermal expansion or by doping, thereby achieving different
lattice parameters. For perfect Si (111) crystals the temperature difference
between two adjacent crystals would have to be equal or larger than 9°C
( DEext = 77 neV, see table 1). The total energy
band width covered by the multi-monochromator nDEext is much smaller than the energy range of a BS spectrometer.
Therefore the center of gravity of this energy band has to be scanned either
via the Doppler effect or via thermal expansion.
 (50)
(50)
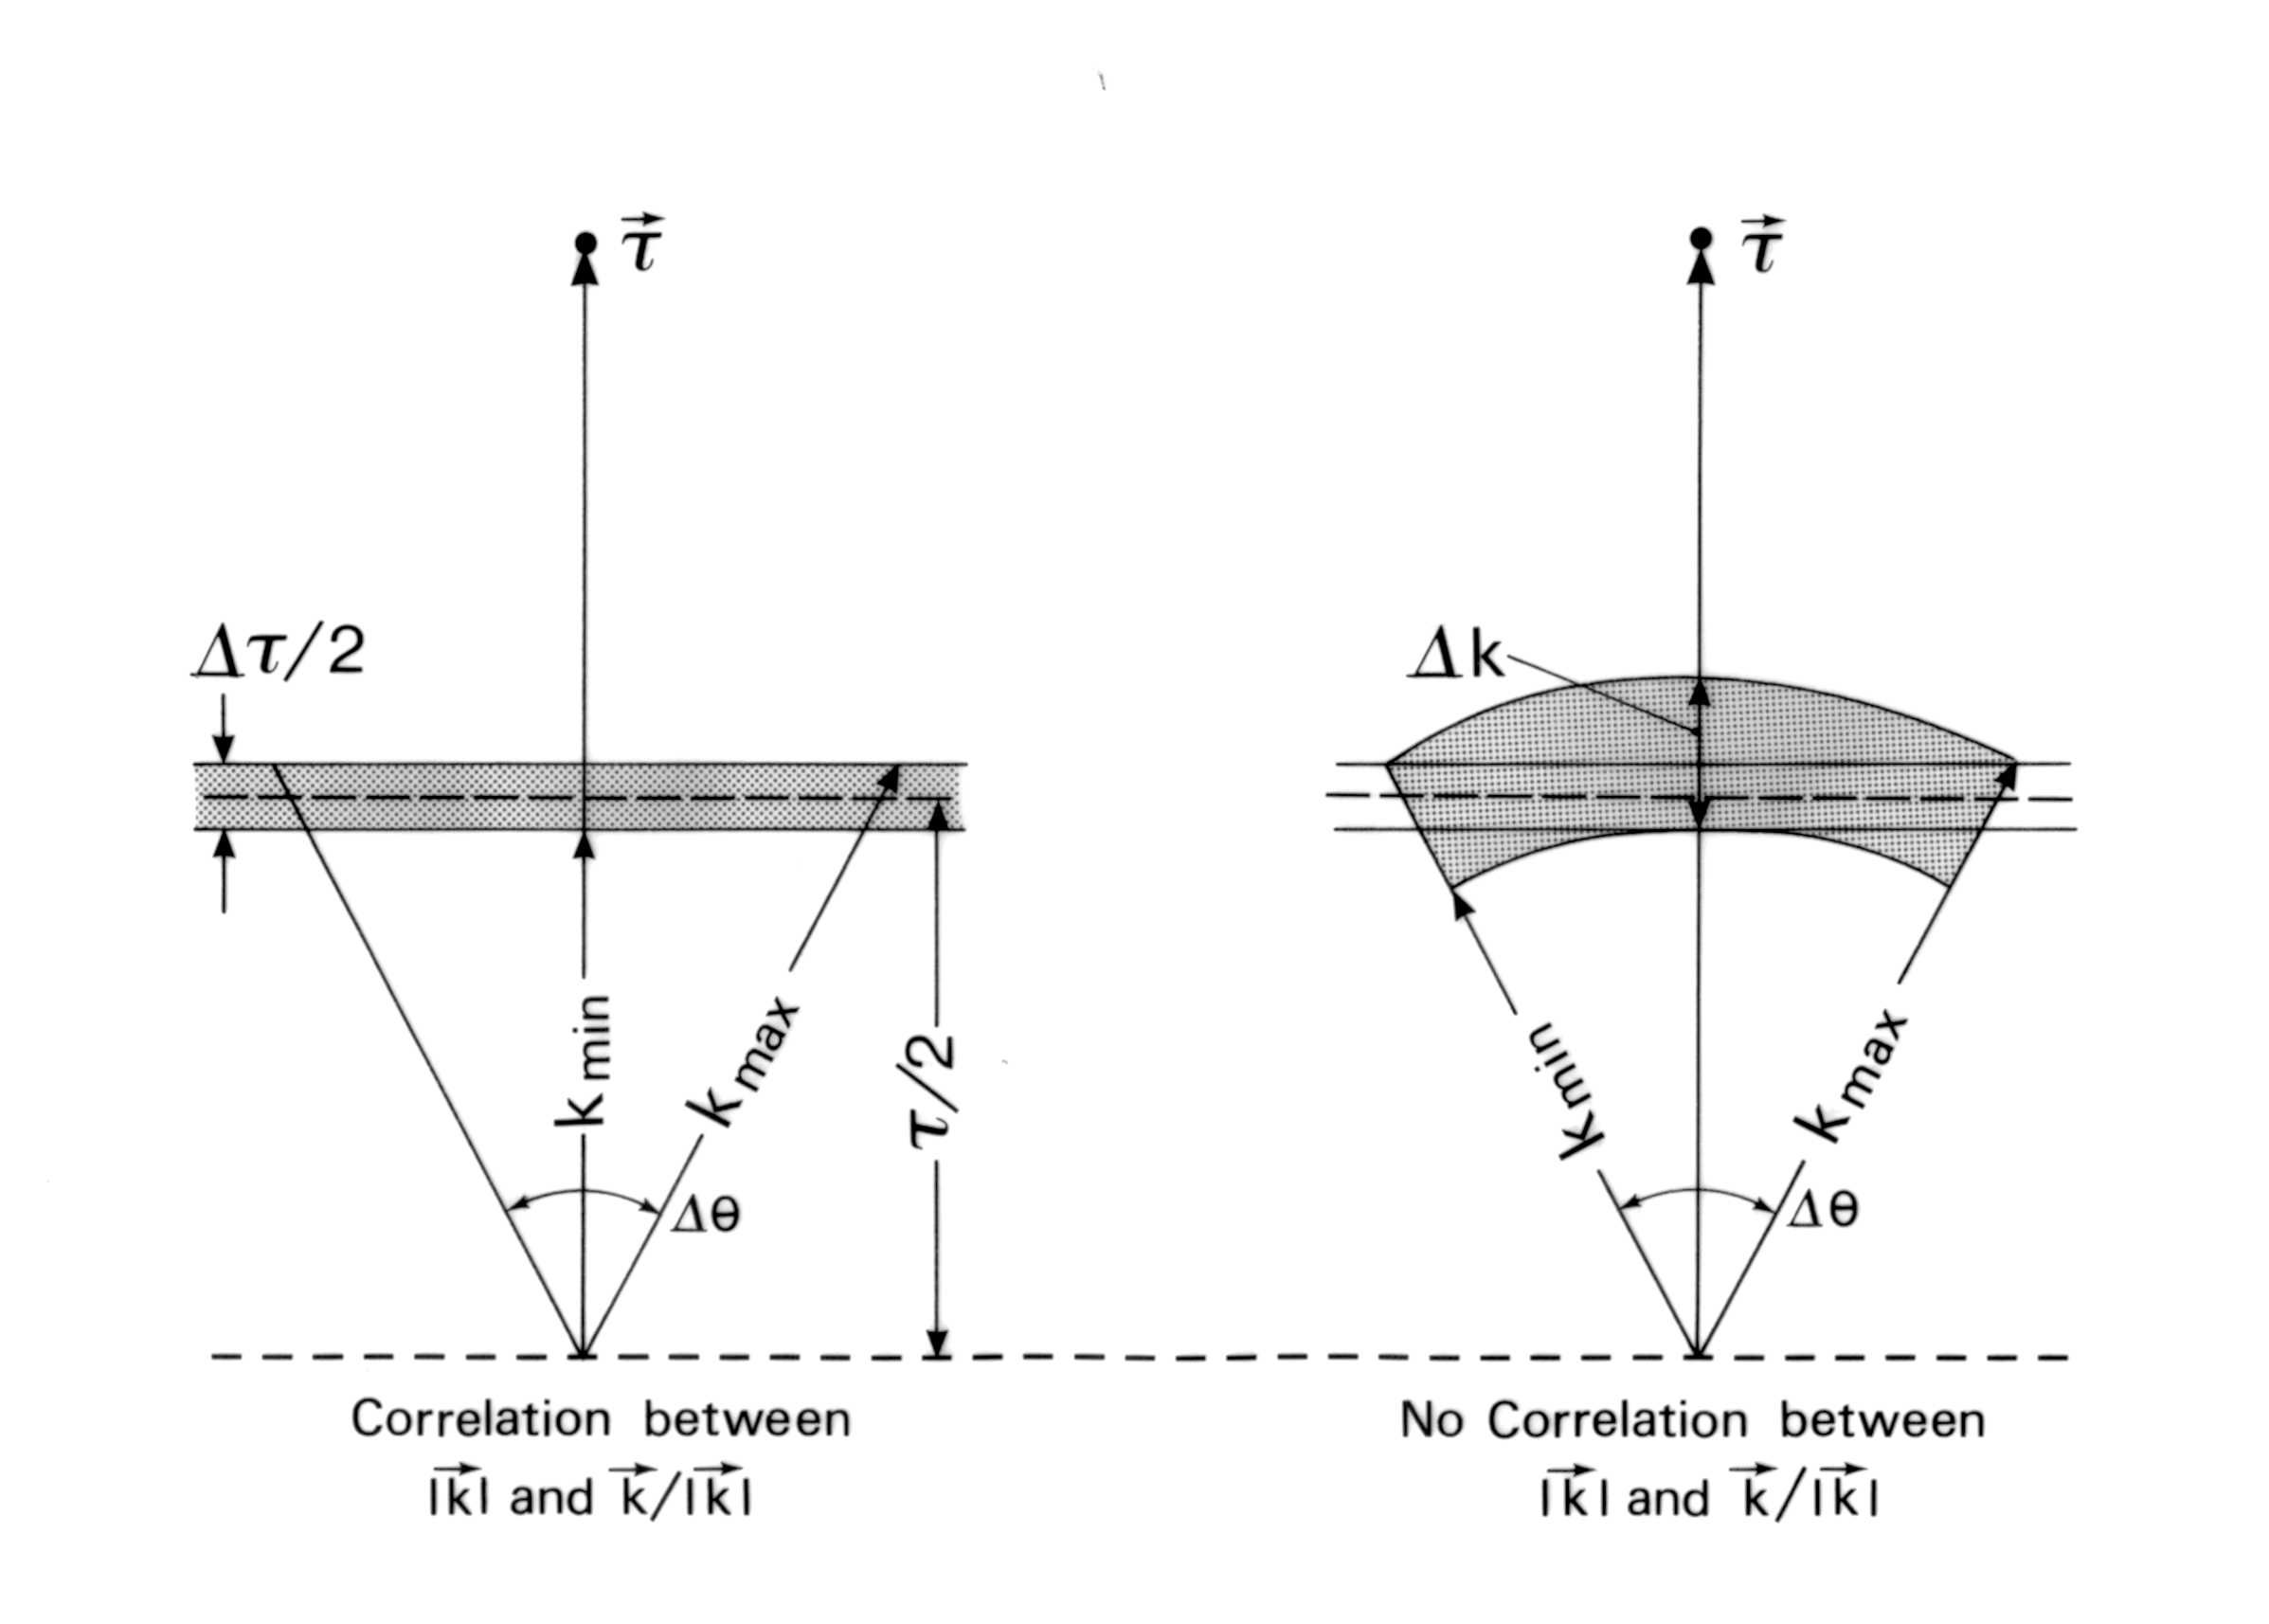


