
Page 55 - ILL Annual Report 2019
P. 55
SCIENTIFIC HIGHLIGHTS
52-53
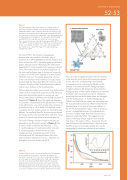
Figure 1
The phase diagram of the system studied. We used a mixture of 𝛼 diglycerol monoolein (DGMO), which promotes lamellar phase, L , Capmul® GMO-50 (main component monoolein) and which in turn promotes a reverse phase, and the dispersant polysorbate 80 (P80), which promotes swelling of the cubic phase into a sponge phase and facilitates dispersions into particles. By varying the ratio of DGMO and GMO-50 we could also vary the type of structure formed.
L3 Dispersed Nanoparticles
Cubic Phase
Sponge Phase
224 Here, reverse bicontinuous cubic (Q of spacegroup 224 (Q ) and
230 (Q230)), reverse hexagonal (H ), lamellar (L ) and sponge (L ) 2𝛼3
phases are indicated. Illustrations of the cubic and sponge phases are inserted, as is a Cryo-TEM image of the dispersed sponge nanoparticles (L3-NP).
The role of P80 in the formation of sponge-like nanoparticles was revealed in this study using a combination of SANS (SANS2D at the ISIS Neutron and Muon source of the STFC Rutherford Appleton Laboratory, Didcot, UK) and neutron reflectometry (the reflectometer SuperADAM [11], the Swedish CRG instrument at the ILL). The L3-NPs structure features local phase separation, as the more swollen bilayer type of structure on the particle surface is rich in P80 at the expense of a more DGMO/ GMO-50 -rich core. The sponge phase inner structure
of the core was found to be retained. Our study clearly demonstrated that Polysorbate 80 both contributes to the formation of highly swollen inverse bicontinuous phases and acts as a stabiliser of the formed particles.
So how does this swollen, yet structured, core shell particle interact with an interface? To reveal the formed interfacial layer when the particles attach to a surface we used neutron reflectometry, benefitting from the high resolution of SuperADAM. Figure 2 shows the significant adsorption of L3-particles, characterised by the appearance of a fringe in the reflectometry curve. Such a fringe does not show up for the bare silica in a D2O buffer. The reflectivity curves recorded in the H2O solvent contrast are also significantly different. The interfacial lipid film structure was not altered by rinsing, as the curves recorded before and after rinsing in the D2O contrast were found to be almost identical.
The results of fitting a four-layer model to the data are presented as the SLD profile inserted in Figure 2. The four-layer model consisted of the following: 1. SiO2; 2. Lipid headgroups; 3. Lipid hydrocarbon tails; and, 4. Lipid headgroups, where the inner and outer headgroups were considered equivalent in terms
of thickness and SLD. The total thickness of the lipid layers formed by adsorption from an L3- dispersion on hydrophilic silica was found to be 63 Å.
Figure 2
Neutron reflectivity curves, illustrating the effect of L3-NP adsorption on a (hydrophilic) silicon surface, are shown as a function of momentum transfer (q). The curves were recorded before addition of L3-NPs (grey for D2O and light red for H2O), after adsorption
of L3-NPs in the deuterated buffer (black) and after rinsing with deuterated (blue) and protonated water (red). Experimental and fitted data are depicted as symbols and a solid line, respectively. The embedded plot shows the scattering length density (SLD) values as a function of distance from the interface obtained from the fitting.
This is an order of magnitude thinner than the diameter of the particles, which shows that the particles spread to form a thin film, corresponding to lipid bilayer,
on hydrophilic silica, confirming the flexibility of the particles. It is noteworthy that the headgroup region
is highly hydrated (≈ 80 %) and also thinner than the headgroup layer in P80 micellar dispersions as observed by SANS, which was found to be 23 Å. Taking into account the fact that the thickness values are averaged over the whole surface, i.e. that the headgroups of DGMO and GMO-50 are smaller, the results show that the reduced thickness observed reflects the fact that the adsorbed layer is a mixture of lipids and stabiliser. In
the 33 Å thick hydrocarbon region—there is almost no solvent—as expected because of its hydrophobicity.
This value is slightly larger than those found for the L3 dispersion studied by SANS. This suggests that the
lipids uín interfacial bilayer might be more ordered
than those in the bilayers of the L3 dispersions. The tail layer thickness on the adsorbed layer is less than twice the P80 tail size in the micelles and the tails may be interdigitated or tilted when confined at an interface.
www.ill.eu
