
Page 31 - ILL Annual Report 2019
P. 31
SCIENTIFIC HIGHLIGHTS
28-29
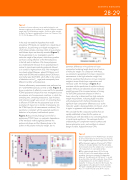
Figure 2
A selection of neutron reflectivity curves and fits (bilayer fits with Gaussian roughness at all interfaces) for a range of different molecular weight (Mw) PS/PCBM bilayer samples. Curves are offset vertically for clarity. This figure is reproduced from Hynes et al. Commun. Phys. 2:112 (2019) under a CC BY 4.0 license.
In this study we tested the hypothesis that model amorphous OPV blends can rapidly form a liquid/liquid equilibrium, by performing an in-depth investigation in which bilayer samples consisting initially of pure polymer and fullerene layers are thermally annealed (figure 1). The key parameter in our investigations was the molecular weight of the polymer, which theory predicts can have a strong influence on the thermodynamics
in the bulk and at interfaces. We chose polystyrene
as a model polymer because its low polydispersity (in contrast to typical semiconducting polymers) allowed
us to conduct a high-resolution study. We investigated two closely related fullerenes, phenyl-C60-butyric acid methyl ester (PCBM) and bis-adduct phenyl-C60-butyric acid methyl ester (bis-PCBM), which differ in the number of sidechains on the C60 cage (and consequently have different miscibility with polystyrene).
Neutron reflectometry measurements were performed on D17 and FIGARO (and also on Inter at ISIS). Figure 2 shows a selection of reflectivity curves and fits for annealed PCBM/polystyrene bilayers that were investigated across an extensive set of measurement conditions, in which the annealing time, annealing temperature, layer thickness and molecular weight were varied. On annealing there
is diffusion of PCBM into the polystyrene layer to form a polymer-rich layer, but no transfer of polystyrene into the PCBM layer (for all measurements conditions). This asymmetry is consistent with the expected equilibrium behaviour of a polymer/small-molecule system.
Figure 3 shows the key findings from the fits for polystyrene/PCBM: there is a systematic dependence of the interfacial width (roughness) between the polymer-rich phase and the fullerene phase in this system on the polymer molecular weight, but no
systematic differences in the polymer-rich layer composition (scattering length density) as a function
of molecular weight. For comparison with theory,
we extracted a χ parameter from layer composition measurements in the high molecular weight limit,
and then predicted the behaviour at lower molecular weights in terms of both layer compositions and interfacial width. The findings in figure 3 are consistent with the predictions of equilibrium theory: broader interfaces are obtained at lower molecular weight because of the increased entropy of mixing.
For bis-PCBM/polystyrene bilayers (in which a
lower value of χ is determined from high molecular weight measurements, indicating higher miscibility
with polystyrene), both interfacial broadening and significant layer composition differences occur as the molecular weight is decreased (data not shown), which is again in agreement with theoretical predictions.
We conclude that the composition profiles that are rapidly established in these thin-film systems on annealing are well described as two co-existing phases in liquid–liquid equilibrium. We anticipate that this understanding will complement material synthesis and device optimisation work, and contribute to rational design of stable, high-performance OPVs.
Figure 3
Bilayer fit parameters for PS/PCBM bilayers annealed at various temperatures for various times, as a function of the weight-average molecular weight (Mw) of the PS
a) The (Gaussian) roughness of the buried PS/PCBM interfaces in annealed samples. Inset) The same data, but showing the lower Mw samples only, in conjunction with measurements on unannealed samples.
b) The scattering length density (SLD) of the top (initially PS) layer in the samples before and after annealing, showing no systematic Mw-dependent behaviour. The data points at 344 kg mol-1 in a) and b) are from Môn et al. [4] (in each plot, three of these annealed data points are from samples that were heated for 10 minutes, the others for 60 minutes). The legend applies to the data points in both a) and b). This figure is reproduced from Hynes et al. Commun. Phys. 2:112 (2019) under a CC BY 4.0 license.
www.ill.eu
