
Page 37 - ILLS Annual Report 2018
P. 37
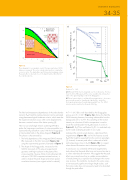
 Figure 2
Phase diagram for our vanadium crystal. Plus signs mark where SANS data were measured. The vortex order-disorder transition is marked by crosses in circles. The dashed lines are fits based on Lindemann criteria. The peak effect is observed close to the depinning line rather than at the order-disorder line.
The field and temperature dependences of the order-disorder transition Bdis(T) and the melting transition can be estimated using phenomenological Lindemann criteria, which state that the respective transition occurs when vortex displacements become a certain fraction of the lattice spacing [4].
Here we use small-angle neutron scattering (SANS) to probe the long-range correlations of vortex ensembles in a superconducting vanadium crystal. We find a Bragg glass at intermediate fields in the phase diagram (figure 2). This phase is characterised by:
1. The field dependence of the integrated SANS intensity I(B), measured on the D22 instrument (figure 3a) using the experimental geometry illustrated in figure 1.
2. The shape of the Bragg peaks, measured on the SANS-II instrument at PSI using an experimental geometry with high resolution in the plane of the vortex ensemble. Reverse Monte Carlo refinement [5], with up to 220 000 computer-simulated vortices, is used to analyse the peak shape and extract spatial correlation functions [see original article for details].
a) Diffracted SANS intensity integrated over the rocking curve. The lines show the form of I(B) expected if the vortex ensemble has either perfect order or the quasi-long-range order of the Bragg glass.
b) Critical current density jc calculated from magnetisation. jc decreases monotonically except for a small peak, labelled Bpp, just before
the sharp downturn where thermal depinning takes over. The SANS intensity vanishes much before the peak effect Bpp.
At T = 1.6 K, I(B) is well described by the Bragg glass picture up to B = 0.26 T (figure 3a). Above this field the SANS intensity plummets, becoming indiscernible from the background at B = 0.29 T. This vanishing of the neutron intensity as a function of field or temperature is used to locate the order-disorder line Bdis(T) (crosses in circles in figure 2). Bdis(T) lies well below Bc2(T); it is mediated only by the weak underlying disorder in our crystal.
Looking at the critical current density jc determined from magnetometry (figure 3b), we find no features around Bdis(T) that might be expected from the common paradigm [1]. Instead, a nascent peak effect is observed at fields and temperatures close to Bc2(T) (figure 3b) in a region where thermal fluctuations start to become significant.
In conclusion, our combined SANS and magnetometry study shows that the peak effect may not a priori be due to a vortex order-disorder transition. We suggest that the peak effect may instead arise from a sudden accommodation
of weak pinning by a rapid but local change in the vortex core structure. This instability, localised to the vortex cores, is not necessarily significant at larger length scales, such that vortex order does not necessarily need to be disturbed through the peak effect.
Magnetometry Neutron data
104 103
102
107 106 105
4 10
Perfect crystal
a)
b)
Figure 3
Results at T = 1.6 K.
0.1
0.2 B (T)
0.3 Bpp
Bc2 0.4
SCIENTIFIC HIGHLIGHTS
34-35
jc (A m-2 ) Integrated intensity I (a. u.)
“Bragg glass” picture
www.ill.eu
