
Page 25 - ILLS Annual Report 2018
P. 25
SCIENTIFIC HIGHLIGHTS
22-23
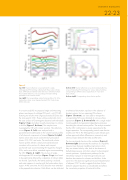
Figure 2
top left) Neutron reflectivity curves (symbols) of a single, solid-supported LPS monolayer obtained with three water contrasts: D2O, SMW (silicon-matched water) and H2O. Solid lines indicate the simulated reflectivity curves according to the best-matching parameters in the common model.
top right) The corresponding volume fraction profiles of Si, SiO2, hydrocarbon chains, inner oligosaccharides (IOS), O-side chains (OSC) and water.
In a recent study [4] we prepared single and interacting planar monolayers of wild-type LPS from E. coli O55:B5, featuring not only the inner oligosaccharides (IOS) but also the strain-specific OSC. These surfaces realistically mimic the outer surface of Gram-negative bacteria both individually (figure 1, top) and when mutually interacting in a colony or biofilm (figure 1, bottom). The samples were investigated by NR with contrast variation. The reflectivity curves (figure 2, left) were analysed with a parameterised model based on the volume fraction profiles of all chemical components of interest (figure 2, right), namely silicon (Si), silicon oxide (SiO2), hydrocarbon chains, IOS, OSC and water. The saccharide volume fraction profiles exhibit a clearly bimodal distribution consistent with a picture of a dense and compact saccharide layer accommodating the negatively charged IOSs, and a more dilute, extended region accommodating the OSC (figure 2, right). The structure of single, solid-supported LPS monolayer (figure 1, top) was found to be significantly affected by a depletion of calcium (data not shown). Specifically, the lateral packing is reduced, and water appears to overlap with the hydrocarbon chain region. At the same time, the IOSs become more extended in the perpendicular direction. Both effects can be attributed
bottom left) Neutron reflectivity curves and simulated reflectivity curves of interacting LPS monolayers for various relative humidities corresponding to different surface separations an r H2O and D2O contrasts.
bottom right) Corresponding volume fraction profiles.
to enhanced electrostatic repulsion in the absence of divalent cations. For two opposing LPS surfaces
(figure 1, bottom), we were able to interpret the corresponding NR curves obtained at various surface separations (figure 2, bottom left) with a single model involving global and separation-dependent parameters describing the volume fraction profiles. The analysis revealed that the OSC conformation is nearly unperturbed at the largest separation. The corresponding central water fraction reaches over 90 %. The heterogeneous water release upon surface approach reflects differences in connectivity and chemical nature between the IOSs and the OSC.
The low saccharide fraction at the midplane (figure 2, bottom right) demonstrates the existence of a liquid-like aqueous layer between neighbouring bacteria when
they are situated side by side, both in the absence of dehydrating pressures and when subject to physiological osmotic pressures. Hydrodynamic pathways for the intercellular transport of small enough molecules can therefore be sustained in colonies and biofilms. At the same time, the observed significant mutual interpenetration of adjacent OSC ‘brushes’ suggests that shear friction between adjacent bacteria is considerable and affects
the viscoelastic properties of bacterial biofilms.
www.ill.eu
